

Introduction
With the release of Visual Studio 2015, which occurred in recent days, there are several new features for developers than the version 2013. One of these is support for debugging of our applications, which we will cover in this article. This is the first of a small series of seven mini-articles, where we will explain with text and images all the news, improvements and additions of other instruments to those already existing. Let us first a list of topics that we will cover:
- Diagnostic Tool
- Timeline Tool
- PerfTips
- New features of BreakPoint
- Conditional BreakPoint
- Hit counts
- Tracepoints
- Debug on lambda Expression
- UI Debugging tool for XAML
- Network Tool
Diagnostic Tool
This is not a real novelty, with this tool we can:
- Check realtime memory consumption.
- Check the consumption of the CPU (all processors).
- Having a debugger events.
- Check the amount of resources it consumes our application.
- Check the level of application performance.
As mentioned, this tool was also available in Visual Studio 2013, except that it was not possible to see in one screen what is written in the preceding paragraphs. If we start Visual Studio 2013, and by opening any project (I use the professional version), the menu DEBUG and immediately after performance and diagnostics, you will see that in the next screen by selecting "Memory Usage" will not be possible to activate other tools.

Clicking on the button starts, at the bottom left, start debugging our application and displays the memory consumption as shown in the figure.
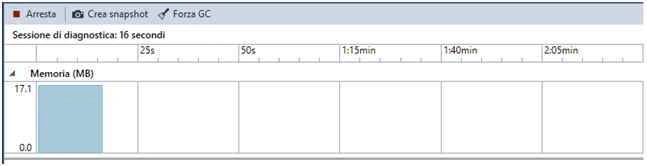
Stopping debugging, we can then see through a file type diagsession all results. But let's see how this tool has been modified but mostly improved in Visual Studio 2015. We start Visual Studio 2015, open any project, F5 to start debugging, and we will notice a difference already, the tool Diagnostic tool starts automatically. We see down through the window Diagnostic Tools as shown.

That's not all; if we compare this with the previous one will notice or other details:
- Event displays debugger, memory consumption and CPU usage all in one screen.
- Top left a drop down menu where you can choose to display or just the use of memory or CPU.
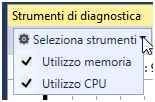
- Three other types of visualization that are lower to the next, including Debugger, this is what we display in the Output window when we compile our solution. "Memory usage" with the ability to create snapshots, or a display of objects in memory, and more details with the ability to create more then to perform a comparison, and finally "CPU Usage"; the latter, however, requires that the application is running without debugging. As you can in Visual Studio 2013 go obviously to select a period of time where we see excessive memory consumption and create us as mentioned snapshot as shown in the following figures.

We have selected a span of time equal to 2.279 seconds, creating the first snapshot, create another.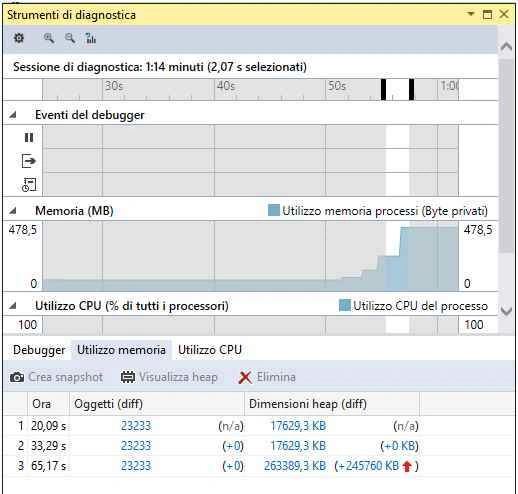
Below we see snapshots that are created using the Create button snapshot, where we have the time, or when it was created, the first after 20.09 seconds, the other two after 33.29 and 65.17 seconds after the start of 'application. We have a number of objects for each snapshot and the size of the heap in the latter have also a display of differences, given by the arrows in red or green to indicate whether there has been an increase or decrease of objects between a snapshot and the other. If we click with the mouse on one of the three that's what we'll show.
For each selected object from the list type object, we can see details in the window below where we have the endorsements routes root and type to which you refer, but also the quantity for each item, the total size in bytes and inclusive. Among these objects we obviously those of the dotnet framework, and of course objects that we add in the code, then lists or another. Another thing to see, are the debugger events, or a kind of recorder of every event that happens in our application, such as the click of a button. To test this feature, insert a breakpoint to the click event of a button as shown.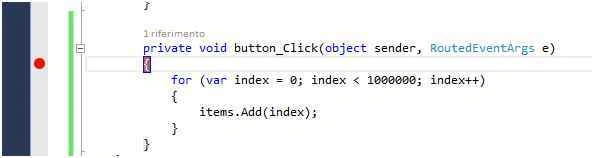
We initiate debugging and we click on the button, returning to the window display Diagnostic tools we realize that was intercepted our clicks and debugging is still on break point.
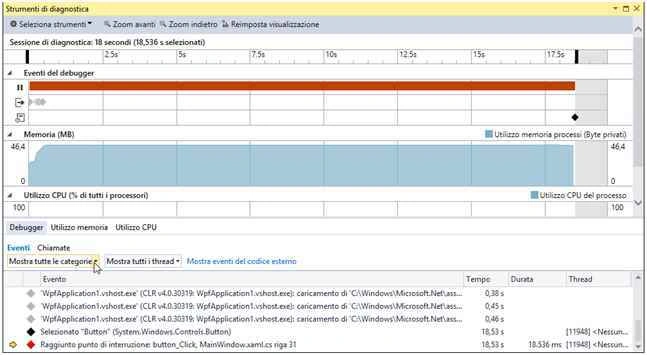
We in the Events section of the debugger, the diamonds in gray, black and red. Gray is reported to the events of the external code, Black reported to the graphical interface while red means that debugging is still on break point. If we go into detail, we note that the click on the button you ran 18.53 seconds after the application starts. We can still using the drop-down box Show all categories, the filter desired display, as shown in the figure.
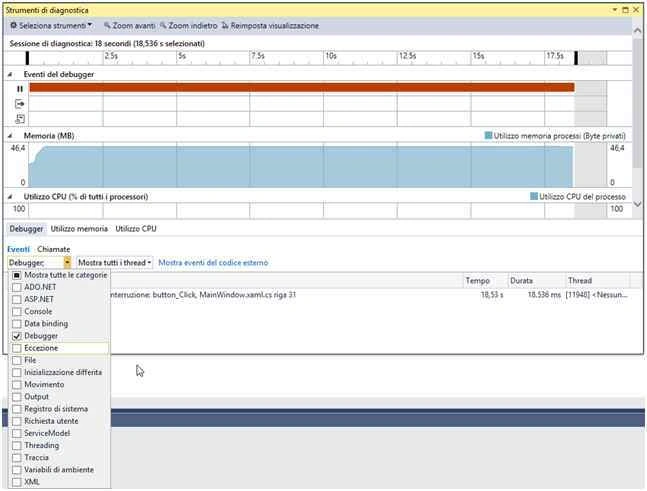
We are interested to view the events for which we select the checkbox Debugger, and here is the display after the selection.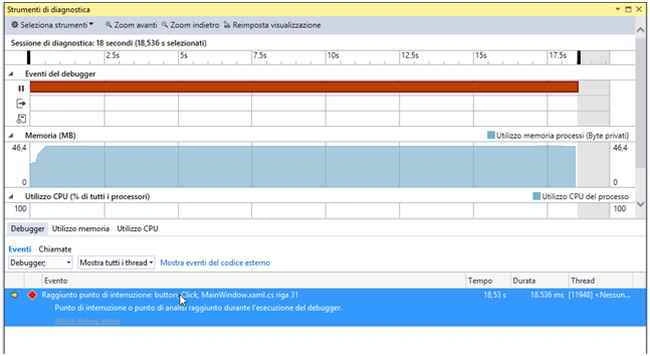
Lastly, CPU usage, but as I said, we have to run without debugging. We go back to Visual Studio 2015, in the Debug menu, select the command Start diagnostic tools without debugging, go to the next window select the CPU Usage.
Click on the button starts, and will start the application, perform a few clicks on the button by checking what happens.

We will notice that with each click in the CPU usage, there will be changes, indicating the CPU consumption in a time frame. Now click on the Stop button, in the upper left, the application will be stopped and created a report on file with digression.
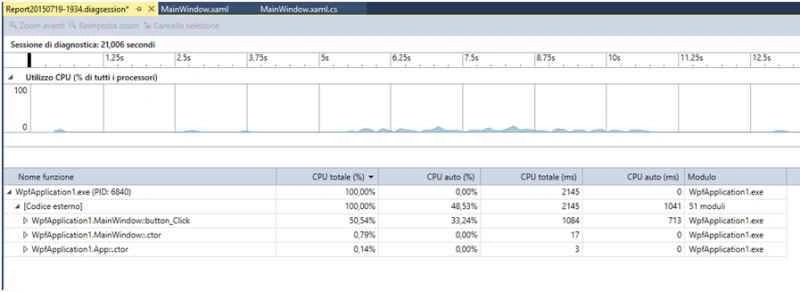
As for the use of memory, we can select a time and check the CPU usage that we will see in detail in the bottom of the screen, and also the possibility here to run filters for a more detailed view.
Project supported
When the diagnostic tool is supported in these technologies.
- Managed WPF, WinForms, Console projects.
- Native Win32, Console, and MFC projects.
- ASP.NET projects running on a local IIS and IIS Express.
- Managed or Native Windows Store projects.
- Debugging sessions started using Debug –> Attach to Process.
- Debugging apps running on remote desktop devices.
They are not supported instead:
- Windows Store projects that are using JavaScript.
- Windows Store projects that are running on a Windows Phone.
- Debugging when Managed or Native Compatibility Mode is checked in Tools –> Options –> Debugging
Conclusion
In this first article, we explored the Diagnostic tool, with which we can see the memory usage, CPU and check all the events that occurred through the Events section of the debugger. We have seen how to select a span of time in the Session diagnostics and create the snapshot for the verification of the quantity of objects in memory, to end with the tool CPU usage. In the next article we will make an introduction of a new tool, not available in Visual Studio 2013, the timeline tool.
Ajeet MishraPosted Sep 21, 2015, 7:05 AM
nice
Sumit JoshiPosted Sep 21, 2015, 3:32 AM
Thanks for sharing....
Nilesh JadavPosted Sep 21, 2015, 1:21 AM
Nice !! Great post ! Helped me to explore more in vs15
Karthikeyan KPosted Sep 20, 2015, 11:26 PM
Good one sir...Thanks for sharing
Pooja BaraskarPosted Sep 20, 2015, 3:04 PM
Thanks for Sharing, its good to see that you are working on holidays too ;)
Rajeesh MenothPosted Sep 20, 2015, 1:09 PM
Good One..Thanks for sharing
Santhakumar MunuswamyPosted Sep 20, 2015, 10:37 AM
Good Work. Thanks for sharing
Sibeesh VenuPosted Sep 20, 2015, 7:44 AM
Nice Share
Muhammad Aqib ShehzadPosted Sep 20, 2015, 7:35 AM
good one
Ankit BansalPosted Sep 20, 2015, 4:34 AM
nice one..thanks for sharing...