

Introduction
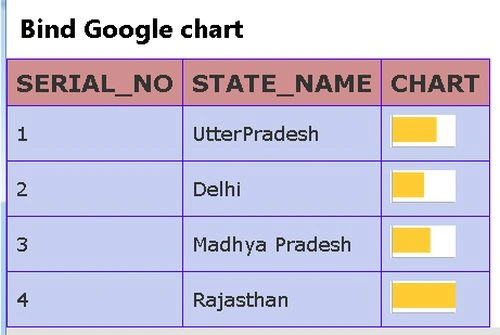
This article describes how to bind Google Chart in a WebGrid. Here we add a WebGrid that shows a chart of the state population.
Procedure for creating the application.
Step 1
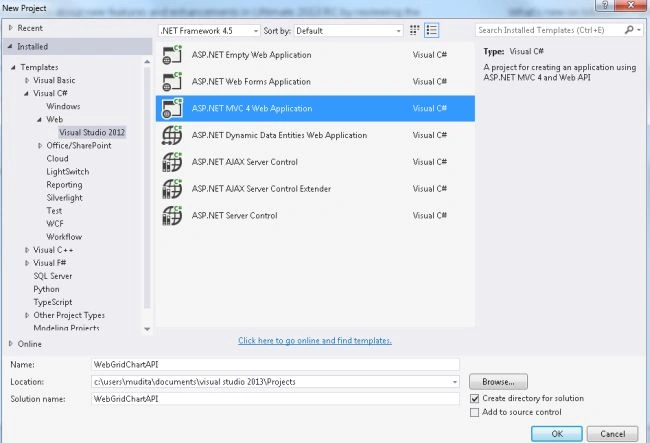
First we create a Web API application as in the following:
- Start Visual Studio 2013.
- From the Start Window select "New Project".
- From the new project window select "Installed" -> "Visual C#" -> "Web" -> "Visual Studio 2012".
- Select "ASP.NET MVC4 Web Application" and click the "OK" button.
- From the "MVC4 project" window select "Web API".
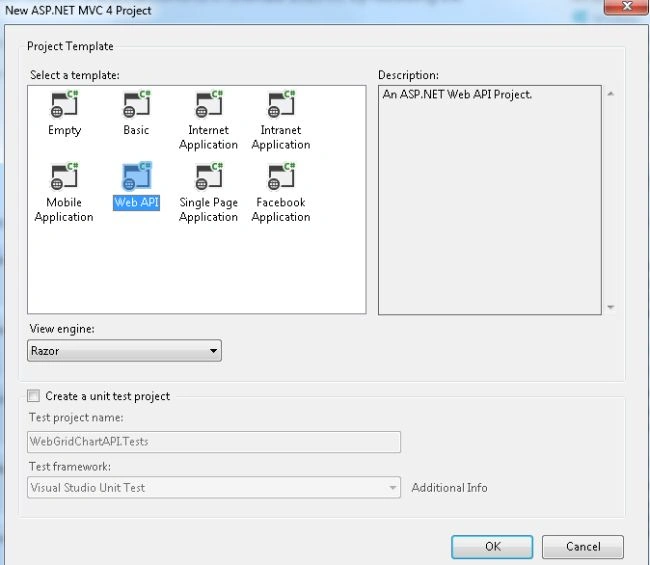
- Click on the "OK" button.
Step 2
Add a Model folder as in the following:
- In the "Solution Explorer".
- Right -click on the "Model folder".
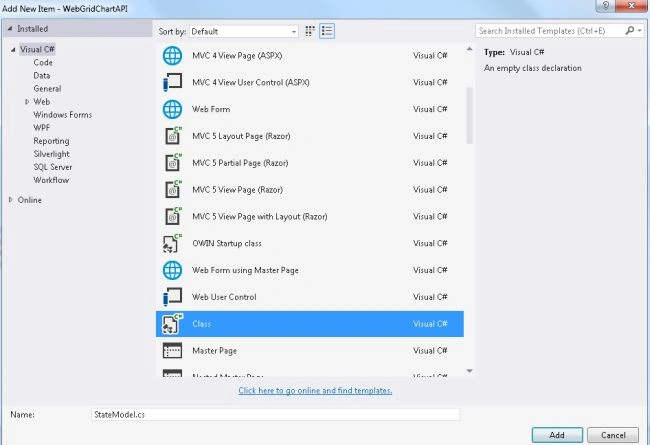
- Select "Add" -> "class".
- From the add item window select "Installed" -> "Visual C#".
- Select "Class" and click on the "Add" button.
Add the following code:
- using System;
- using System.Collections.Generic;
- using System.Linq;
- using System.Web;
- namespace WebGridChartAPI.Models
- {
- public class StateModel
- {
- public List<State> StateValueModel { get; set; }
- }
- public class State
- {
- public int ID { get; set; }
- public string StateName { get; set; }
- public int Population { get; set; }
- }
- }
Step 3
Now in the "Controller" we add the code that uses all the variables of the Model class. This file exists:
-
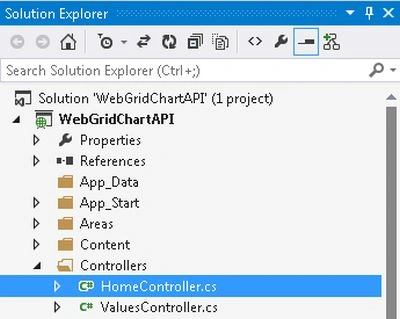
In the "Solution Explorer".
-
Expand the "Controller" folder.
-
Select the "HomeController".
Add the following code:
- using System;
- using System.Collections.Generic;
- using System.Linq;
- using System.Web;
- using System.Web.Mvc;
- using WebGridChartAPI.Models;
- namespace WebGridChartAPI.Controllers
- {
- public class HomeController : Controller
- {
- public ActionResult Index()
- {
- ViewBag.Message = "Bind Google chart";
- StateModel obj = new StateModel();
- List<State> obj1 = new List<State>();
- obj1 = GetStateList();
- obj.StateValueModel = obj1;
- return View(obj);
- }
- public List<State> GetStateList()
- {
- List<State> objstate = new List<State>();
- objstate.Add(new State { ID = 1, StateName = "UtterPradesh", Population = 70 });
- objstate.Add(new State { ID = 2, StateName = "Delhi", Population = 50 });
- objstate.Add(new State { ID = 3, StateName = "Madhya Pradesh", Population = 60 });
- objstate.Add(new State { ID = 4, StateName = "Rajasthan", Population = 100 });
- return objstate;
- }
- }
- }
Step 4
In the View write some code as in the following:
-
In the "Solution Explorer".
-
Expand the "Views Folder"
-
Select "Home" -> "Index.cshtml".
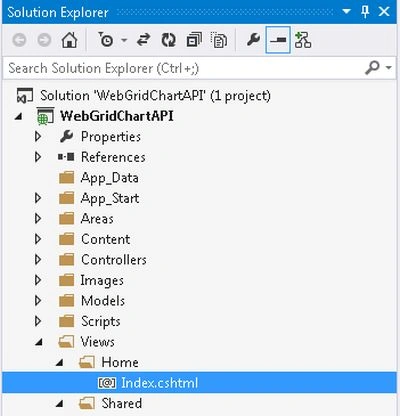
Add the following code:
- @model WebGridChartAPI.Models.StateModel
- @{
- ViewBag.Title = "Bind grid";
- } <h2>@ViewBag.Message</h2>
- @{
- var grid = new WebGrid(source: Model.StateValueModel, rowsPerPage: 10);
- }
- <style type="text/css">
- table.gridtable {
- font-family: verdana,arial,sans-serif;
- font-size:large;
- color:#333333;
- border-width: 1px;
- border-color: #4800ff;
- border-collapse: collapse;
- }
- table.gridtable th {
- border-width: 1px;
- padding: 8px;
- border-style: solid;
- border-color: #4800ff;
- background-color: #d18e8e;
- }
- table.gridtable td {
- border-width: 1px;
- padding: 8px;
- border-style: solid;
- border-color: #4800ff;
- background-color: #c6cff1;
- }
- </style>
- @grid.GetHtml(alternatingRowStyle: "even",
- tableStyle: "gridtable",
- columns: grid.Columns(
- grid.Column("ID", "SERIAL_NO"),
- grid.Column("StateName", header: "STATE_NAME"),
- grid.Column("Population", header: "CHART", format:
- @<text><img src="https://chart.googleapis.com/chart?cht=bhs&chd=t:@item.Population&chs=60x30" alt="@item.Population" /></text>)
- ))
Step 5
Execute the application. The output will be as:
Chanel ChooPosted Jun 3, 2015, 9:47 AM
Thanks!