
Save the following code as an .ASPX web page on your .NET web server to try this sample using GDI+ encapsulated in a class to display a primitive line chart. The class features an arraylist to hold a dynamic number of chart points and utilizes transforms to simplify the plotting of worldview data points. Enhancements would add color options, multiple lines, other chart types, and printing.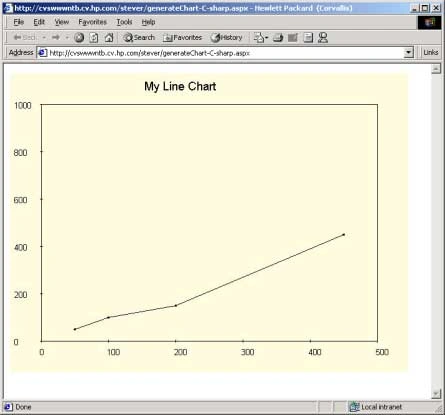
<%@ Page Language="C#" %>
<%@ Import Namespace="System" %>
<%@ Import Namespace="System.Drawing" %>
<%@ Import Namespace="System.Drawing.Drawing2D" %>
<%@ Import Namespace="System.Drawing.Imaging" %>
<script language="C#" runat="server">
class LineChart
{
//Sample ASPX C# LineChart Class
public Bitmap b;
public string Title="Default Title";
public ArrayList chartValues = new ArrayList();
public float Xorigin=0, Yorigin=0;
public float ScaleX, ScaleY;
public float Xdivs=2, Ydivs=2;
private int Width, Height;
private Graphics g;
private Page p;
struct datapoint
{
public float x;
public float y;
public bool valid;
}
//initialize
public LineChart(int myWidth, int myHeight, Page myPage)
{
Width = myWidth; Height = myHeight;
ScaleX = myWidth; ScaleY = myHeight;
b = new Bitmap(myWidth, myHeight);
g = Graphics.FromImage(b);
p = myPage;
}
public void AddValue(int x, int y)
{
datapoint myPoint;
myPoint.x=x;
myPoint.y=y;
myPoint.valid=true;
chartValues.Add(myPoint);
}
public void Draw()
{
int i;
float x, y, x0, y0;
string myLabel;
Pen blackPen = new Pen(Color.Black,1);
Brush blackBrush = new SolidBrush(Color.Black);
Font axesFont = new Font("arial",10);
//first establish working area
p.Response.ContentType="image/jpeg";
g.FillRectangle(new
SolidBrush(Color.LightYellow),0,0,Width,Height);
int ChartInset = 50;
int ChartWidth = Width-(2*ChartInset);
int ChartHeight = Height-(2*ChartInset);
g.DrawRectangle(new Pen(Color.Black,1),ChartInset,ChartInset,ChartWidth,ChartHeight);
//must draw all text items before doing the rotate below
g.DrawString(Title, new Font("arial",14), blackBrush, Width/3, 10);
//draw X axis labels
for(i=0; i<=Xdivs; i++)
{
x=ChartInset+(i*ChartWidth)/Xdivs;
y=ChartHeight+ChartInset;
myLabel = (Xorigin + (ScaleX*i/Xdivs)).ToString();
g.DrawString(myLabel, axesFont, blackBrush, x-4, y+10);
g.DrawLine(blackPen, x, y+2, x, y-2);
}
//draw Y axis labels
for(i=0; i<=Ydivs; i++)
{
x=ChartInset;
y=ChartHeight+ChartInset-(i*ChartHeight/Ydivs);
myLabel = (Yorigin + (ScaleY*i/Ydivs)).ToString();
g.DrawString(myLabel, axesFont, blackBrush, 5, y-6);
g.DrawLine(blackPen, x+2, y, x-2, y);
}
//transform drawing coords to lower-left (0,0)
g.RotateTransform(180);
g.TranslateTransform(0,-Height);
g.TranslateTransform(-ChartInset,ChartInset);
g.ScaleTransform(-1, 1);
//draw chart data
datapoint prevPoint = new datapoint();
prevPoint.valid=false;
foreach(datapoint myPoint in chartValues)
{
if(prevPoint.valid==true)
{
x0=ChartWidth*(prevPoint.x-Xorigin)/ScaleX;
y0=ChartHeight*(prevPoint.y-Yorigin)/ScaleY;
x=ChartWidth*(myPoint.x-Xorigin)/ScaleX;
y=ChartHeight*(myPoint.y-Yorigin)/ScaleY;
g.DrawLine(blackPen,x0,y0,x,y);
g.FillEllipse(blackBrush,x0-2,y0-2,4,4);
g.FillEllipse(blackBrush,x-2,y-2,4,4);
}
prevPoint = myPoint;
}
//finally send graphics to browser
b.Save(p.Response.OutputStream, ImageFormat.Jpeg);
}
~LineChart()
{
g.Dispose();
b.Dispose();
}
}
void Page_Load(Object sender, EventArgs e)
{
LineChart c = new LineChart(640, 480, Page);
c.Title="My Line Chart";
c.Xorigin=0; c.ScaleX=500; c.Xdivs=5;
c.Yorigin=0; c.ScaleY=1000; c.Ydivs=5;
c.AddValue(50,50);
c.AddValue(100,100);
c.AddValue(200,150);
c.AddValue(450,450);
c.Draw();
}
</script>
Mahsa HassankashiPosted Dec 3, 2012, 8:10 AM
It is exactly my requirement, Thank you.
vachan chauhanPosted Jul 14, 2011, 12:13 AM
How to show Multiple Graphs on same page?
Neeraj SharmaPosted Jun 3, 2010, 3:48 AM
How to draw multiple line on same graph.
Vineeta AgarwalPosted Oct 9, 2009, 2:05 AM
Hi This is the same as I needed. But I need one more thing. I have to show the tooltip of each point. How can i do that? I have Drawen the (3,45) point as string at that point but it is showen like mirror image. Because we have rotated it on 180 angle. how can i do that?
shilin pmPosted Oct 1, 2009, 7:06 AM
this code given is working and very helpful. if any one know more about this then please help me to draw column chart (bar chart) in asp.net . waiting for your replys
jasPosted Jun 15, 2009, 4:32 PM
LineChart c = new LineChart(640, 480,Page); Error 2 Argument '3': cannot convert from 'System.Web.UI.Page' to 'Page'
rakesh ladPosted Feb 6, 2009, 5:09 AM
Hi sir, As your are using Response.OutputStream to save and dispaly the image it only work on IE browser. I find it difficulty to get same result on Opera and Netscape Navigator browser. Please do the needful. Regards, Rakesh ([email protected])
Kalyan ManadaptiPosted Dec 29, 2008, 12:06 PM
help me out for placing Y1 and Y2 axis for a single X Axis, Bot Y1 and Y2 values are different.
Kalyan ManadaptiPosted Dec 29, 2008, 12:03 PM
I want a sample code for Windows appliaction
Jeff CambierPosted Nov 15, 2007, 9:38 AM
Do you have the code in VB.Net for this line graph for ASP.Net? Thanks. [email protected]
Hari SinghPosted Oct 19, 2007, 2:07 AM
protected void Page_Load(object sender, EventArgs e) { LineChart lc= new LineChart(640, 480, Page); lc.Title = "My Line Chart"; lc.Xorigin = 0; lc.ScaleX = 500; lc.Xdivs = 5; lc.Yorigin = 0; lc.ScaleY = 1000; lc.Ydivs = 5; lc.AddValue(50, 50); lc.AddValue(100, 100); lc.AddValue(200, 150); lc.AddValue(450, 450); Draw(); } 'LineChart1.LineChart(int, int, System.Web.UI.Page)' is a 'method' but is used like a 'type'
Hari SinghPosted Oct 19, 2007, 2:02 AM
'LineChart1.LineChart(int, int, .Web.UI.Page)' is a 'method' but is used like a 'type'
Nguyen Xuan QuangPosted Jun 28, 2007, 6:04 AM
chartValues.Add(myPoint) Error : Name 'ChartValues' doesn't exist in a present context.