

It is available during debugging only and helpful to examine threads in a multi-threaded application. We can open it in VS 2015, from Debug -> Windows -> Threads or using shortcut Ctrl+Alt+H.
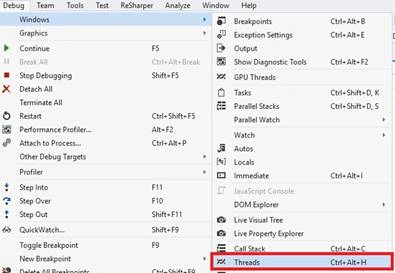
Let’s create a console Application to understand it better with the code given below.
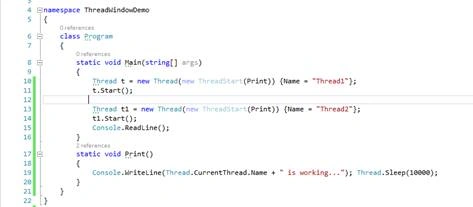
Here, we created two threads and executed the same method to display the thread name and sleep current thread for 10 seconds. Let’s keep a breakpoint and debug it to examine those threads in Threads Window.
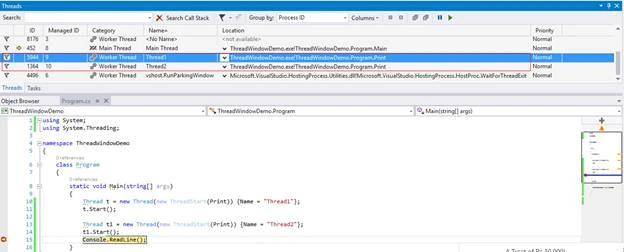
Let’s look at the columns, which are helpful in Threads window,
- Flag column is used to flag\unflag a thread, on which we need to focus.
- Active thread column indicates a currently executing thread with a yellow indicator.
- The ID column contains the identification number of the thread.
- The Managed ID column contains the managed identification numbers for the managed threads.
- The Category column categorizes threads as main thread, UI threads, RPC handlers or worker threads.
- The Name column will display the thread name, if it has one, else as <No Name>.
- Location column helps to look at the currently executing code, expanding it will show complete stack trace of the thread. In a multithreaded program, each thread has its own call stack. This column provides a convenient way to view the stack.
We can expand\collapse and search in call stack with the options available in the Window.
We can also sort the group or filter by flag and add new columns to threads Window.

We can switch execution from active thread to another one by clicking on “Switch to Thread”.

We can freeze a thread, so that the system will not execute it.
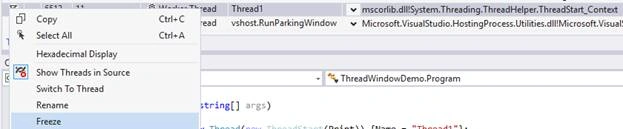
Similarly, we can resume\un-freeze a thread by clicking on Thaw.

When we freeze a managed thread, its suspended count will be 1, as shown below.

I am ending the things here. I hope, this is informative.
Join the conversation! Your thoughts help the community grow.