Admittedly the art in Figure 1 is a bit disturbing, but nonetheless, it could probably pass for art and it was not painted by a human hand, but by a computer algorithm. A number of people in the art world are experimenting with what is known as evolutionary art and even sold a few of their works. Genetic Art is a subset of evolutionary art and uses genetic algorithms to generate the art. To learn more about evolutionary and genetic art, I recommend visiting the Organic, Genetic, and Evolutionary Art Page.
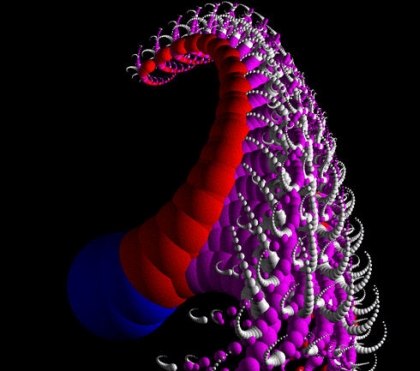
Figure 1 - Genetic Art from Computer Artworks
In this article we will experiment a bit with genetic algorithms and creating fitness functions that produce art on a Windows Form. For the purpose of simplicity, we will generate art in 2 dimensional space using approximations to data points determined from a few general mathematical formulas. The genetic algorithm program we are using utilizes Multiple Expression Programming (MEP). Multiple Expression Programming produces gene sequences of mathematical formulas and in this example the fitness of the formulas are compared against a set of data. To learn more about MEP, check out my previous article, Using Multiple Expression Programming to Derive the Pythagorean Theorem in C# and .NET.
The basic idea behind creating art from mathematical equations, is to produce a color from a formula operating on an x,y coordinate. (In three dimensions you would produce a color from an (x,y,z) coordinate.). In our example we gear our formulas to produce 4 possible colors from results ranging from 0-3. The first dataset for comparing our fitness was derived from the simple formula shown below:
(a + b) mod 4
This formula forces all our simulated results to values between 0 and 3 The genetic algorithm will produce genes that try to converge on a formula that approximates the formula shown above. Its actually better that the algorithm not converge to the correct answer (a+b) mod 4, because the approximation to the formula is what produces the original art. In fact, you may want to choose functions in your MEP genes that are a bit more unusual (In this examples some of the genes include sin(a*b), a/b, and abs (a) + abs(b). Also, you can place a few inaccurate results in the fitness set, to add some interesting effects. Below are some of the resulting artworks produced from genes after 1000 generations of converging on the formula:
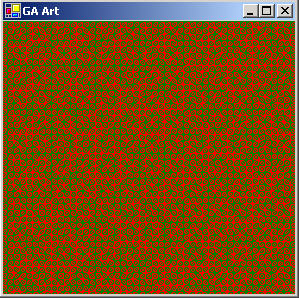
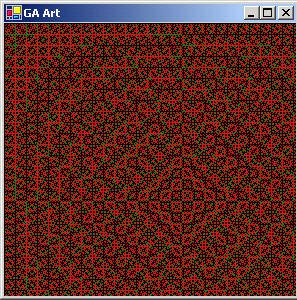
Figure 2 - Genetic Art Produced from the fitness formula (a+b) mod 4
Seeing as the module 4 convergence did some interesting things, we chose a similar formula for our next art gallery, ab mod 4. We also introduced some (ab) mod 5 data into the dataset to cause some strange convergences:
(ab) mod 4
Figure 3 - Textures generated from the fitness set of (ab) mod 4
Finally, keeping with our success of the modulus function, we created a set of numbers based on:
ab mod 5
Changing the color scheme a bit, by producing a different set of colors from the results of (0-4) and running the algorithm on a 1000 generations against the ab mod 5 data, we get the art textures shown below:
Figure 4 - Art Work based on running the genetic algorithm on the formula set ab mod 5
Some may argue that this computer generated art is not exactly Van Gogh, but it does provoke the eye a bit, and there is no limit to the number of creations you can produce. By tweaking the set of measured results, the gene formulas utilized by the algorithm, the number of colors produced, and the variety of colors produced, you can really come out with a few cool abstract pieces (who knows, maybe even a masterpiece!)
The Code
The genetic algorithm produces genes that represent formulas. When you plug a set of coordinates into the formula it produces a number that represents a color. The color plotting method called Plot is shown below for the EquationGenome in Listing 1. Basically, a color is assigned to each pixel on the form based on the coordinates of the pixel when they are plugged into the equation genome. You can alter the colors represented by the integers to produce different color combinations. You can also reduce or increase the colors at different intervals to change the color resolution of the output.
Listing 1 - Plot the Genome's color based on plugging the Form Coordinates into the Genome Equation
public
void Plot(Form1 TheForm, Graphics g)
{
// Fill the whole form with a light gray color to erase old drawing
g.FillRectangle(Brushes.LightGray, TheForm.ClientRectangle);
// go through each x,y coordinate and plug it into the equation
// produced by the genome to derive an integer representing a
// color
for (int i = 0; i < 300; i++)
for (int j = 0; j < 300; j++)
{
double calc1 = PerformCalculation(i, j); // do calculation
if (calc1 > 4)
g.DrawLine(Pens.LightBlue, i, j, i+1, j);
else if (calc1 > 3)
g.DrawLine(Pens.Purple, i, j, i, j+1);
else if (calc1 > 2)
g.DrawLine(Pens.Red, i, j, i+1, j);
else if (calc1 > 1)
g.DrawLine(Pens.Yellow, i, j, i, j+1);
else
g.DrawLine(Pens.Navy, i, j, i+1, j);
}
}
The data points for the fitness function ab mod 5 are shown in listing 2a. The first 2 numbers in each triple set are a and b respectively. The last number is the resulting value of the equation ab mod 5.
Listing 2a - Fitness Set for the Equation ab mod 5
double
[,] measure5 = new double[,]
{
{0, 0, 0}, {0, 1, 0}, {0, 2, 0}, {0, 3, 0}, {0, 4, 0},
{1, 1, 1}, {1, 2, 1}, {1, 3, 1}, {1, 4, 1}, {1, 5, 1},
{2, 1, 2}, {2, 2, 4}, {2, 3, 3}, {2, 4, 1},
{-2, 2, 4}, {3, -2, .111}, {3, -5, .00411}, {-1,5,-1}, {2,4,1},
{2,5,2}, {3,4,1}, {3,7, 2}, {2,9,2}, {5, 2, 0},
{6, 2, 1}, {7, 2, 4}, {4, 2, 1}, {11, 2, 1}, {3, 2, 2},
{-2, 1, -2}
};
The fitness function for comparing to the data points Listing 2a is shown below in Listing 2b. Each data point is read into the fitness function and compared against the calculation of the genome. The sum of the comparisons produces a fitness that tells us how close we are to the measured set in Listing 2a. This approximate equation produced by the genome is what gives us the interesting anomalies that produces the textures in figure 4.
Listing 2b - Fitness Function for the Equation Genome
public
double CalculateArtFitness5()
{
double fitness = 0.0;
double calc = 0.0f;
double sum = 0.0f;
// go through each data point (produced from the formula a pow b mod 5)
// and calculate a fitness of the equation
for (int i = 0; i < measure5.GetLength(0); i++)
{
calc = PerformCalculation(measure5[i, 0], measure5[i, 1]); // do calculation
// calculate a fitness number comparing the actual measured value
// to the value produced by the equation
double error = 100 - Math.Abs(measure5[i, measure5.GetLength(1)- 1] - calc); // last byte
// add it to the overall average
sum += error;
// if its an undefined result, return a low fitness
if (double.IsNaN(calc))
return .001;
}
// normalize the fitness
CurrentFitness = sum/(measure5.GetLength(0)*100);
// if its an undefined result, return a low fitness
if (double.IsNaN(CurrentFitness))
CurrentFitness = 0.001f;
// don't allow fitnesses less or equal to zero
if (CurrentFitness <= 0.0)
CurrentFitness = .001;
return CurrentFitness;
}
Conclusion and New Horizons
It would be great to alter this code slightly to plot 3 dimensional color mappings and see what sort of landscapes are produced in the results. Although we played with the sine function here in our genome, one could choose hyperbolic sine, arc tangent, and a few non-linear functions as part of the genome construction to produce other strange effects. Reducing the color set to 2 colors may also prove interesting. Also changing the genomes to include complex number math functions would give us a whole new realm to explore. Anyway, enjoy creating colorful art without that messy paint all over your genes with C# and .NET.