Introduction
This article presents a WPF application which can be used to import and display geographic maps that are stored in the ESRI shapefile format. Public domain maps utilizing this format are readily available on the web and several such sources are listed in the References section below. Note that I wrote this application solely as a learning experience, and the mapping theme was chosen simply because it seemed like an ideal way for myself to explore the graphics functionality in WPF, including the use of geometries, shapes, and transformations.
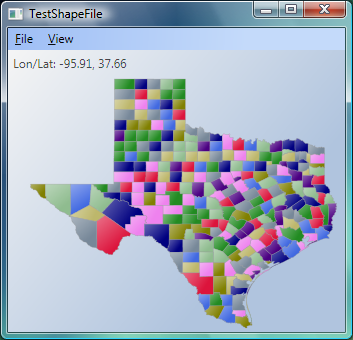
Figure 1: Demo application displaying a shapefile of Texas.
The Shapefile Format
ESRI (Environmental Systems Research Institute) is a leading developer of GIS software and the shapefile format used by their products is one of the most popular mediums for storing vector map data. Many government departments and agencies, such as the U.S. Census Bureau, provide freely downloadable maps in the form of ESRI shapefiles.
The structure of a shapefile is described in detail in the whitepaper, ESRI Shapefile Technical Description. The demo application was developed entirely based on this specification, together with various MSDN articles on WPF.
An ESRI shapefile is actually composed of three separate files: a main file with a .SHP extension, an index file with a .SHX extension, and a dBASE file with a .DBF extension that contains the associated attribute data. The three files must have the same basename and follow 8.3 naming conventions as shown in the figure below.
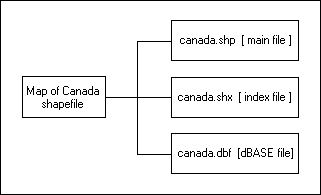
Figure 2: Components of a shapefile.
The main file (with a .SHP extension) is the primary component and its structure begins with a fixed-length, 100-byte header containing information about the total length of the file, the file version, and the type of shapes it contains. This file header is then followed by a list of variable-length records, with each record defining the geometry for a single ESRI shape. An ESRI shape might be a polygon that represents the political boundary of a country, a polyline that represents the path of a city street, or a point object that indicates the location of a city. The figure below illustrates the format of a .SHP file.
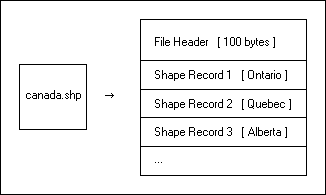
Figure 3: The format of the .SHP file.
The index file (with a .SHX extension) simply consists of record offset values for the corresponding .SHP file. Using the index file, you can seek directly to a shape record of interest. However, for the purposes of the demo application, I do not use the index file at all since I want to sequentially read every shape record within the .SHP file.
The demo project contains a source file, ShapeFile.cs, which offers a set of classes and functionality for reading an ESRI shapefile. One of the classes, ShapeFileHeader, represents the contents of the 100-byte file header. The public interface of this class is shown below, with XML commenting tags omitted for brevity.
public class ShapeFileHeader
{
// Constructor.
public ShapeFileHeader() { ... }
// File properties.
public static int Length { ... }
public int FileCode { ... }
public int FileLength { ... }
public int Version { ... }
public int ShapeType { ... }
// Bounding-box for the shapefile (decimal degrees).
public double XMin { ... }
public double YMin { ... }
public double XMax { ... }
public double YMax { ... }
// Output some of the file properties.
public override string ToString() { ... }
}
In the class above, an interesting item to note is the ShapeType property. The presence of this property in the header indicates that a shapefile can contain only one type of ESRI shape. For example, a shapefile might contain only polyline shapes (representing a road network), or only polygon shapes (representing lake boundaries). If you think of a map as being composed of multiple layers of information (roads, lake boundaries, state boundaries, etc), then a shapefile is generally used to represent just a single layer of features within an overall map. Thus, the creation of an overall map may require the composition of multiple shapefiles.
For reference, the public interface of the ShapeFileRecord class is shown below.
public class ShapeFileRecord
{
// Constructor.
public ShapeFileRecord() { ... }
// Record properties.
public int RecordNumber { ... }
public int ContentLength { ... }
public int ShapeType { ... }
// Bounding-box for this shape (decimal degrees).
public double XMin { ... }
public double YMin { ... }
public double XMax { ... }
public double YMax { ... }
// Shape geometry specification.
public int NumberOfParts { ... }
public Collection<int> Parts { ... }
public int NumberOfPoints { ... }
public Collection<Point> Points { ... }
// Attributes associated with this shape.
public DataRow Attributes { ... }
// Output some of the record properties.
public override string ToString() { ... }
}
Reading ESRI Shapes
The shapefile header and each shape record consist entirely of numeric values. There is no text in these records since all attribute data is stored in the external dBASE file. The numeric values are either signed 4-byte integers, or signed 8-byte double-precision numbers (IEEE floating point format). For example, the ShapeType field in the file header is encoded as an integer whereas all bounding box values are encoded as doubles. Normally, the System.IO.BinaryReader class would be sufficient to read these values from an opened file stream. However, while most integer fields in the shapefile are encoded using little-endian (Intel) byte ordering, there are certain other fields which are encoded using big-endian byte ordering. For example, the FileLength field in the file header is encoded as a big-endian integer. To read these big-endian values, I use the following code, which simply reads bytes from a stream into a buffer in reverse order, and then uses the System.BitConverter
private static int ReadInt32_BE(Stream stream)
{
for (int i = 3; i >= 0; i--)
{
int b = stream.ReadByte();
if (b == -1)
throw new EndOfStreamException();
intBytes[i] = (byte)b;
}
return BitConverter.ToInt32(intBytes, 0);
}
Reading dBASE Attributes
The dBASE file associated with a shapefile contains the attribute data and essentially represents a single database table. There is a one-to-one correspondence between the rows in this table and the shape records in the .SHP file. A typical attribute field that you may find in a dBASE table is a field that identifies the name of the corresponding shape (such as a state or province name).
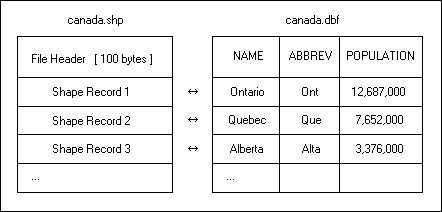
Figure 4: The mapping between the .SHP file and the dBASE file.
To read the contents of the dBASE file, I simply use an OleDbConnection
string connectionString = "PROVIDER=Microsoft.Jet.OLEDB.4.0;Data Source=" +
directory + ";Extended Properties=dBASE 5.0";
And the corresponding select query might look as follows:
string selectQuery = "SELECT * FROM [CANADA#DBF];";
One issue with using the Microsoft Jet provider is that it will throw an OleDbException
Displaying Progress
The ShapeFile class is used to represent the contents of an entire shapefile, and provides the top-level functionality for reading an ESRI shapefile. This class offers public methods for reading the entire shapefile at once (including dBASE attributes), or reading the file header and shape records in a piece-wise fashion. The latter option is ideal for displaying progress during a shapefile read operation. The public interface of the ShapeFile class is shown below.
public class ShapeFile
{
// Constructor.
public ShapeFile() { ... }
// Properties.
public ShapeFileHeader FileHeader { ... }
public Collection<ShapeFileRecord> Records { ... }
// Read all shapes and attributes.
public void Read(string fileName) { ... }
// Read all shapes from shapefile.
public void ReadShapes(string fileName) { ... }
public void ReadShapes(Stream stream) { ... }
// Read in a piece-wise fashion.
public void ReadShapeFileHeader(Stream stream) { ... }
public ShapeFileRecord ReadShapeFileRecord(Stream stream) { ... }
// Read dBASE attributes.
public void ReadAttributes(string dbaseFile) { ... }
// Output some properties from the File Header.
public override string ToString() { ... }
}
In order to display a progress window during a read operation, the demo application uses the piece-wise approach to reading a shapefile. In addition, to keep the UI responsive during this procedure, I decided to use the new single-threaded programming model in WPF. By restricting the application to a single thread, it makes the logic simpler and avoids the need for thread synchronization. In order to use this programming model though, you must be able to divide the lengthy task that you wish to perform (e.g., reading a shapefile) into discrete steps or sub-tasks. The reading of a shapefile fits nicely into this model because the ShapeFile class allows me to read each shape record sequentially and individually.
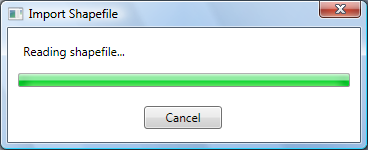
Figure 5: Progress window from the demo application.
As described in the MSDN article, every UI thread queues work items inside a System.Windows.Threading.Dispatcher object. The main idea behind the single-threaded model is that we can also queue our own task items to be executed by the dispatcher. By keeping the amount of processing within each task item to a minimum, we allow the dispatcher to continue processing work items (including UI tasks) in a timely and responsive manner.
Before scheduling our own work items with the dispatcher, we need to define a delegate for a work item:
// Defines the prototype for a method that reads a block
// of shapefile records. Such a method is intended to be
// executed by the Dispatcher.
public delegate void ReadNextPrototype(ShapeFileReadInfo info);
With the delegate defined, we can code a function that adheres to the delegate's method signature and performs the task of reading a block of records from a shapefile. When you schedule a task with the dispatcher, you have the option of specifying a priority for the task. However, in order to have more control over throughput, I introduced the concept of a blocking factor so that we can read multiple records per work item. Increasing the blocking factor increases the read performance but this will occur at the expense of UI responsiveness. Below is the call to the dispatcher which queues the initial work item (task) at normal priority.
this.dispatcher.BeginInvoke(DispatcherPriority.Normal,
new ReadNextPrototype(this.ReadNextShapeRecord), info);
The ReadNextShapeRecord() method represents the work item which reads a block of records from the shapefile, updates the progress window, and schedules the next work item with the dispatcher at background priority.
Creating WPF Shapes
The demo application uses a two-pass approach to importing a shapefile. The first pass reads the file header and every shape record until end-of-file is detected. The second pass then goes into a loop and creates one WPF shape object per ESRI shape record (a WPF shape is a descendant of the System.Windows.Shapes.Shape abstract class). The second pass also updates the progress window using the same threading model that was used during the reading phase.
Now, there are some interesting details concerning the mapping of an ESRI shape record to a WPF shape. For example, an ESRI shape record with ShapeType equal to ShapeType.Polygon may actually be composed of more than one polygon. Consider a shape record representing the state boundary of Hawaii as an example. Since Hawaii is made up of several islands, multiple polygons are needed to represent the state. The shapefile format handles this using the concept of a "part". A part can be thought of as a connected series of points. You will see later that an ESRI part maps very well to the WPF concept of a "figure". If you go back to the definition of the ShapeFileRecord class shown earlier, you'll see a collection property, Parts, which holds a set of indices for the corresponding Points collection. Each value in the Parts collection is an index into the Points collection and identifies the starting point of a part. To illustrate this visually, consider a shape record that consists of two polygons (or parts) as shown below.
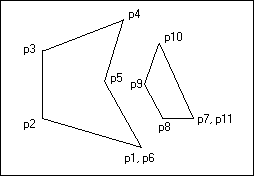
Figure 6: An ESRI shape consisting of two polygons.
The contents of the Parts and Points collections corresponding to the above shape record are shown below.
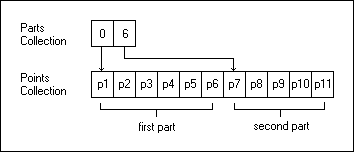
Figure 7: The contents of the Parts and Points collections corresponding to Figure 6.
For my first attempt at mapping ESRI shapes to WPF shapes, I created a separate WPF polygon (System.Windows.Shapes.Polygon) for each ESRI part in a shape record. While this approach worked, it meant that each shape record might result in multiple and separate WPF polygons being created with no simple way to tie them together. Treating the separate polygons as a single entity is important from the standpoint of attributes, since attributes are associated with the shape record as a whole. In addition, we typically want to set the appearance of polygons belonging to the same record using the same colors, brushes, gradients, etc.
Enter the more versatile class, System.Windows.Shapes.Path, which lets you compose almost any type of complex geometry and assign it to the Path.Data property. With this approach, I can match each ESRI shape record with a corresponding WPF Path instance. And, for each part within a shape record, I can map it directly to a WPF path figure (System.Windows.Media.PathFigure
As an example, if there are two ESRI parts in a shape record, two corresponding path figures are generated and added to the Figures collection of a PathGeometry object. The PathGeometry instance is then attached to the Path.Data property. The object hierarchy might be easier to visualize if we look at it using XAML:
<Path>
<Path.Data>
<PathGeometry>
<PathGeometry.Figures>
<PathFigure>
</PathFigure>
<PathFigure>
</PathFigure>
</PathGeometry.Figures>
</PathGeometry>
</Path.Data>
</Path>
Below is a portion of the ShapeDisplay.CreateWPFShape() method which creates a WPF Path instance given an ESRI shape record as input. Once a WPF shape has been created, it can be added to a Canvas where it will be automatically displayed (as long as it is in view).
private Shape CreateWPFShape(string shapeName, ShapeFileRecord record)
{
// Create a new geometry.
PathGeometry geometry = new PathGeometry();
// Add figures to the geometry.
for (int i = 0; i < record.NumberOfParts; i++)
{
// Create a new path figure.
PathFigure figure = new PathFigure();
// Determine the starting index and the end index
// into the points array that defines the figure.
int start = record.Parts[i];
int end;
if ( record.NumberOfParts > 1 && i != (record.NumberOfParts - 1) )
end = record.Parts[i + 1];
else
end = record.NumberOfPoints;
// Add line segments to the figure.
for (int j = start; j < end; j++)
{
System.Windows.Point pt = record.Points[j];
// Transform from lon/lat to canvas coordinates.
pt = this.shapeTransform.Transform(pt);
if ( j == start )
figure.StartPoint = pt;
else
figure.Segments.Add(new LineSegment(pt, true));
}
// Add the new figure to the geometry.
geometry.Figures.Add(figure);
}
...
// Add the geometry to a new Path and set path properties.
System.Windows.Shapes.Path path = new System.Windows.Shapes.Path();
path.Data = geometry;
path.Name = shapeName;
...
}
Transformations
The bounding box and point coordinate values from a shapefile are typically expressed in units of decimal degrees. In other words, these are geographic longitude and latitude values that can be interpreted in the form of a Cartesian grid. On this grid, longitude values range from -180 to +180 degrees, and latitude values range from -90 (South Pole) to +90 degrees (North Pole).
When you use the demo application to open an initial ESRI shapefile, the WPF shapes will be positioned and scaled such that the bounding box of the shapefile is centered within the canvas, maximizes the space used within the canvas, and maintains its original aspect ratio. This is achieved using the WPF transformation classes as shown below. The CreateShapeTransform() method returns a shape transformation object that is applied to each and every point coordinate during WPF shape creation.
private TransformGroup CreateShapeTransform(ShapeFileReadInfo info)
{
// Bounding box for the shapefile.
double xmin = info.ShapeFile.FileHeader.XMin;
double xmax = info.ShapeFile.FileHeader.XMax;
double ymin = info.ShapeFile.FileHeader.YMin;
double ymax = info.ShapeFile.FileHeader.YMax;
// Width and height of the bounding box.
double width = Math.Abs(xmax - xmin);
double height = Math.Abs(ymax - ymin);
// Aspect ratio of the bounding box.
double aspectRatio = width / height;
// Aspect ratio of the canvas.
double canvasRatio = this.canvas.ActualWidth / this.canvas.ActualHeight;
// Compute a scale factor so that the shapefile geometry
// will maximize the space used on the canvas while still
// maintaining its aspect ratio.
double scaleFactor = 1.0;
if (aspectRatio < canvasRatio)
scaleFactor = this.canvas.ActualHeight / height;
else
scaleFactor = this.canvas.ActualWidth / width;
// Compute the scale transformation. Note that we flip
// the Y-values because the lon/lat grid is like a cartesian
// coordinate system where Y-values increase upwards.
ScaleTransform xformScale = new ScaleTransform(scaleFactor, -scaleFactor);
// Compute the translate transformation so that the shapefile
// geometry will be centered on the canvas.
TranslateTransform xformTrans = new TranslateTransform();
xformTrans.X = (this.canvas.ActualWidth - (xmin + xmax) * scaleFactor) / 2;
xformTrans.Y = (this.canvas.ActualHeight + (ymin + ymax) * scaleFactor) / 2;
// Add the two transforms to a transform group.
TransformGroup xformGroup = new TransformGroup();
xformGroup.Children.Add(xformScale);
xformGroup.Children.Add(xformTrans);
return xformGroup;
}
The demo application supports features such as zooming and panning (either by using the keyboard or dragging with the mouse) which are also implemented using transformations. In particular, a TransformGroup instance that I will refer to as the view transformation is attached to the Transform property of every WPF shape element that is created. There is a clear difference between this approach and the shape transformation described earlier. The shape transformation is applied to the point data directly, even before the shape is created, and the transformation object itself is not tied to the resultant WPF shapes. Thus, the advantage of the view transformation is that you can make a change to the transformation's properties (such as changing the zoom factor) and WPF will automatically update the display of every shape on the canvas which is attached to that transformation. This is how the zoom-related menu items are implemented.
Using the WPF transformation classes, you can easily apply inverse transforms as well. For example, given a canvas location, it is easy to apply the inverse of the current view transformation, followed by the inverse of the shape transformation, in order to obtain the corresponding geographic longitude and latitude coordinates.
The TestShapeFile Application
The demo project (TestShapeFile) is a standalone WPF application that I created using VS 2005. On my system, I have installed the November 2006 CTP release of the WCF/WPF extensions for VS 2005, and the Windows SDK for Vista. The screenshot below shows how the Visual Studio project is organized. I ran the project through FxCop 1.35 as well, so the code should be fairly conformant from that respect.
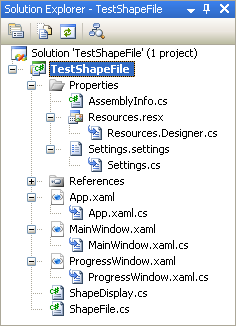
Figure 8: The Solution Explorer view of the demo project in VS 2005.
The ShapeDisplay class that appears in the project can be thought of as a helper class which can be attached to a Window and Canvas in order to add shapefile support. ShapeDisplay manages the reading of ESRI shapes, creation of WPF elements, and updates to the progress window.
The TestShapeFile application simply allows users to import and display shapefiles one by one. The shape transformation described earlier is determined based on the bounding box of the initial shapefile that is loaded. For all subsequent shapefiles, the shape transformation remains unchanged (until the File | Reset menu item is clicked). This means that you can stitch together an overall map by loading shapefiles that cover different regions of the world, for example.
Every WPF shape that is created is given a unique name, such as "Shape28". If the associated shape record has attributes as well, the first five attribute values are formatted into a tooltip string for that shape. The screenshot below shows a map of California with a tooltip being displayed for one of the census regions (shapefile source: U.S. Census Bureau).

Figure 9: Demo application displaying a census region map of California.
Conclusion
The demo application is presented as a basic utility for importing an ESRI shapefile and displaying it in the form of WPF shape objects on a canvas. I basically let WPF handle everything in terms of displaying graphics. Thus, I don't really call this program a shapefile viewer because a viewing application would likely be designed and implemented differently. For example, a viewer might perform the drawing of the shape records directly, much like one would do in WinForms using GDI+. That being said, this program is not suitable for loading large ESRI shapefiles, as the addition of potentially thousands of shape elements (or highly detailed shapes) to a canvas has a big impact on memory and rendering performance.
The shape transformation used by the demo application assumes that the set of geographic longitude and latitude coordinates can be interpreted as being part of a uniform x-y grid. This is sometimes referred to as an equirectangular map projection. Although outside the scope of this article, it would be interesting to explore the possibility of supporting other map projections (such as Mercator) using the WPF transformation functionality.
- ESRI Shapefile Technical Description, July 1998.
- U.S. Census Bureau - Cartographic Boundary Files.
- ESRI World Basemap Data.
- GIS Download Data Server.
- CDC - North America Shapefiles.
- Census 2000 TIGER/Line Data.
- WPF Fundamentals - Threading Model.