

- AutoCompleteBox
- Accordion
- Rating
- DataGrid
- Calendar
- DatePicker
- VisualStateManager
- Chart Controls
This article demonstrates how to draw pie charts using the WPF Toolkit.
Adding WPF Toolkit Reference
Before you can use any charting related functionality in a WPF application, you must download the WPF Toolkit. After that, you need to add a reference to an assembly.
To add a reference, right-click the References folder of your project in Solution Explorer and select Add Reference. This action will open the Add Reference dialog as you can in the following Figure 1. On this dialog, select Browse option and browse the System.Windows.Controls.DataVisualization.Toolkit.dll assembly from the folder where you installed the WPF Toolkit. This assembly resides in the Binaries folder.
Tip: If you do not want to download WPF Toolkit, you can download the attached project and copy WPFToolkit.dll and System.Windows.Controls.DataVisualization.Toolkit.dll assemblies from this project to the bin folder of your project and add reference.
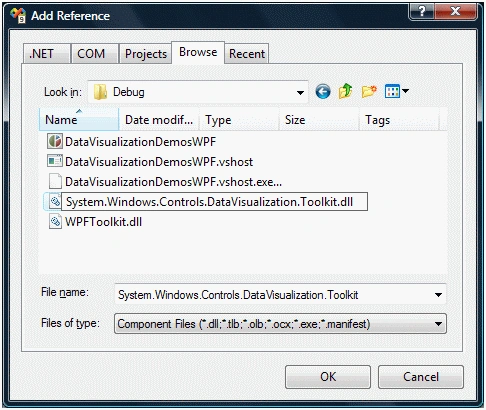
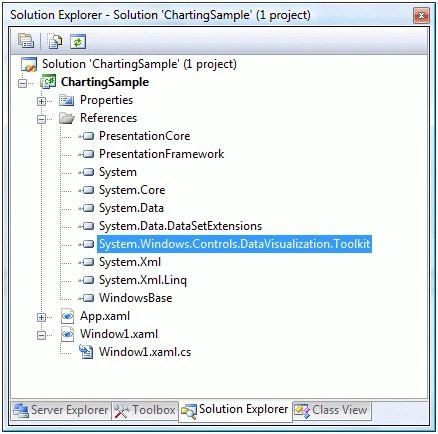
Once you add the reference, you will see the System.Windows.Controls.DataVisualization.Toolkit added to your References dialog as you see in Figure 2.
Now, the next step is to import the System.Windows.Controls.DataVisualization.toolkit and the System.Windows.Controls.DataVisualization.Charting namespaces to the page. Once you type xmlns= in your page, you will see these namespaces in the Intellisense. Select and add both of them to your page as you can see in Figure 3.
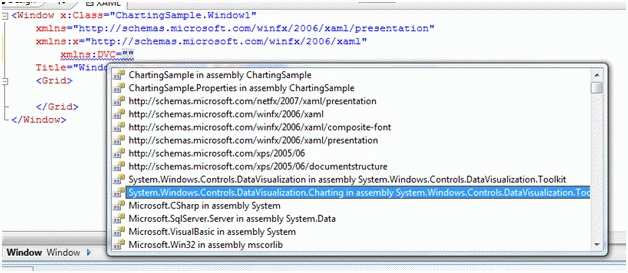
The final references added to the page looks like the following. As you can see here, I added names of these references as DV and DVC.
- xmlns:DV="clr-namespace:System.Windows.Controls.DataVisualization;assembly=System.Windows.Controls.DataVisualization.Toolkit"
- xmlns:DVC="clr-namespace:System.Windows.Controls.DataVisualization.Charting;assembly=System.Windows.Controls.DataVisualization.Toolkit"
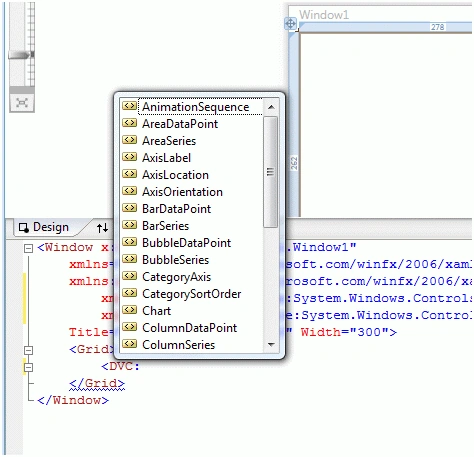
Now you will see DVC in your page and once you select it, you will notice all Charting related elements added to the Intellisense. To add a Chart control to your page, just select the Chart control from the list. The list of charting related elements looks like Figure 4.
Creating a Chart
The Chart element represents a WPF Chart control in XAML.
- < DVC:Chart></DVC:Chart>
The code snippet in Listing 1 creates a Chart and sets its width, height, and background properties of the Chart control. The Title and LegendTitle properties represent the title of the chart and the title of legend.
- <DVC:Chart Name="mcChart" Width="400" Height="250" Background="YellowGreen" Foreground="DarkBlue" Title="Area Chart" LegendTitle="Month Rating" />
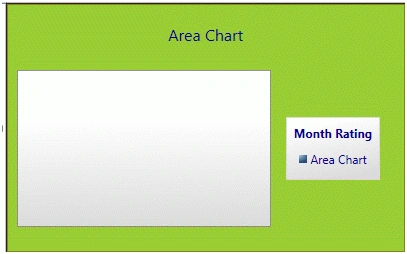
Chart Types
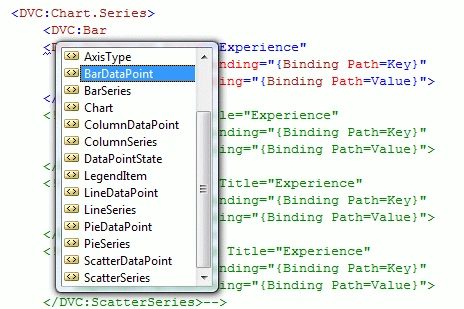
The Series attribute of the Chart element is used to create a chart type. If you see in Figure 6, you will notice BarSeries, ColumnSeries, LineSeries, PieSeries, AreaSeries, and ScatterSeries attributes and based on the attribute, the chart will be created.
Pie Chart
The code snippet in Listing 2 creates a pie chart by setting Chart.Series to PieSeries. As you may see, the binding has occurred on Key and Value fields of a data source.
- <DVC:Chart Canvas.Top="80" Canvas.Left="10" Name="mcChart" Width="400" Height="250" Background="LightSteelBlue">
- <DVC:Chart.Series>
- <DVC:PieSeries Title="Experience" IndependentValueBinding="{Binding Path=Key}" DependentValueBinding="{Binding Path=Value}">
- </DVC:PieSeries>
- </DVC:Chart.Series>
- </DVC:Chart>
Listing 2
The code snippet in Listing 3 creates a collection in KeyValuePair form and sets the ItemsSource property of the chart series. Same data can be used for other chart types.
- privatevoid LoadPieChartData() {
- ((PieSeries) mcChart.Series[0]).ItemsSource = newKeyValuePair < string, int > [] {
- newKeyValuePair < string, int > ("Project Manager", 12),
- newKeyValuePair < string, int > ("CEO", 25),
- newKeyValuePair < string, int > ("Software Engg.", 5),
- newKeyValuePair < string, int > ("Team Leader", 6),
- newKeyValuePair < string, int > ("Project Leader", 10),
- newKeyValuePair < string, int > ("Developer", 4)
- };
- }
Listing 3
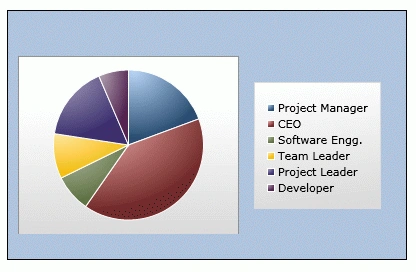
The output looks like Figure 7.
Generating Chart from a Collection
Now we are going to generate a pie chart from a collection. I have a class Fruit that looks like Listing 4. It has two members, Name and Share.
- classFruit {
- publicstring Name {
- get;
- set;
- }
- publicInt16 Share {
- get;
- set;
- }
- }
Listing 4
Listing 5 is a Fruit collection class that adds some Fruit objects in the constructor.
- classFruitCollection: System.Collections.ObjectModel.Collection < Fruit > {
- public FruitCollection() {
- Add(newFruit {
- Name = "Mango", Share = 10
- });
- Add(newFruit {
- Name = "Banana", Share = 36
- });
- Add(newFruit {
- Name = "Apple", Share = 24
- });
- Add(newFruit {
- Name = "Guava", Share = 4
- });
- Add(newFruit {
- Name = "Orange", Share = 12
- });
- Add(newFruit {
- Name = "Pear", Share = 10
- });
- Add(newFruit {
- Name = "Pineapple", Share = 4
- });
- }
- }
Listing 5
Now in our XAML code, I create a resource called FruitCollection and bind it to the PieSeries using the ItemsSource property as listed in Listing 6.
- <Grid.Resources>
- <local:FruitCollection x:Key="FruitCollection" />
- </Grid.Resources>
- <DVC:Chart Canvas.Top="80" Canvas.Left="10" Name="mcChart" Width="400" Height="250" Background="LightSteelBlue">
- <DVC:Chart.Series>
- <DVC:PieSeries Title="Experience" ItemsSource="{StaticResource FruitCollection}" IndependentValueBinding="{Binding Path=Name}" DependentValueBinding="{Binding Path=Share}">
- </DVC:PieSeries>
- </DVC:Chart.Series>
- </DVC:Chart>
Listing 6
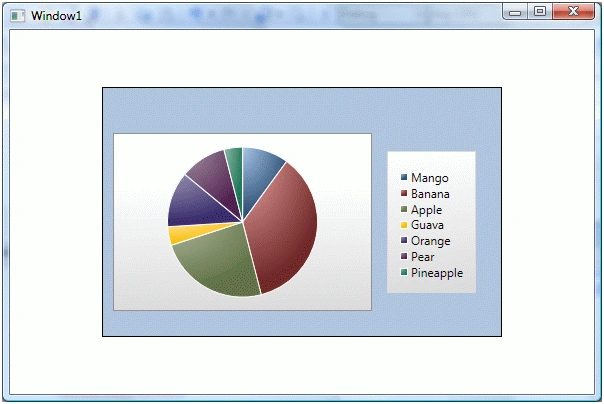
Now simply build and run the project. New output looks like Figure 8.
3D Pie Chart
Here is a URL that shows you how to create a 3D pie chart.
http://www.codeproject.com/KB/WPF/WPF_3D_Pie_Chart.aspx
Des PutuPosted May 3, 2021, 5:38 PM
"The resource "FruitCollection" could not be resolved" this is the error occured in my program.Can you tell me what am I doing wrong?
Andy HenryPosted Jul 18, 2020, 12:25 PM
Thanks for sharing your valuable knowledge, it's save my life bro.
Dinesh GabhanePosted Nov 18, 2019, 4:20 AM
Thanks for sharing
Nhẫn LêPosted Mar 20, 2019, 10:20 PM
Thank you very much, it helpful for me
Rahul YadavPosted Mar 8, 2019, 4:45 AM
How to add same color pie chart
Rinco ZengPosted Dec 10, 2018, 9:19 PM
Thank you a lot! it's good example and Instructions, and how to set static colors for legends? it's important to me.
Theo HodgesPosted Dec 4, 2018, 4:14 AM
When adding the <DVC:Chart> tag, Visual Studio says the name "Chart" does not exist in the namespace. What am I doing wrong?
Rushi MehtaPosted Sep 28, 2018, 1:38 AM
How to display label on the graph
judit sesslerPosted Jan 9, 2018, 12:12 PM
I copied the example and got the error: A value of type 'PieSeries' cannot be added to a collection or dictionary of type 'Collection'. I am using VS2017. Any suggestions why?
Kani MozhiPosted Mar 7, 2017, 7:50 AM
How to add the the percentage inside every segment of pie chart.
ChinnaPosted Aug 29, 2016, 1:27 AM
Hi its very useful for me and i need to know how to set static colors for legends..
Uday BhosalePosted Jul 17, 2013, 12:55 AM
I have implemented Pie chart same way in my application. I am fetching and binding data series from a collection on a button_Show click. I am facing problem when i click show button frequently(Say 5-6 times before the chart could render), pie chart gets frozen to its previous state. After that whatever data you assign to the chart it persists its last state and color. I am unable to trace the issue. Any help would be appreciated.
Anupam somaniPosted Apr 9, 2013, 6:49 AM
how can I Display percentage on piechart in WPF ?
Anupam somaniPosted Apr 8, 2013, 6:50 AM
how can I Display percentage on piechart in WPF ?
Mahesh ChandPosted Feb 13, 2013, 10:19 AM
John, good question. I have not tried it.
John StonePosted Feb 5, 2013, 6:48 PM
Great tutorial on how to implement a basic pie chart. I had a question, since the documentation is very limited on what's available. How would you go about applying a gradient to one slice of the pie chart (such as you can do in excel). Can you bind the gradient stop position and color to a slice?
RanjithKumar chiguruvadaPosted Sep 28, 2012, 10:45 AM
This is a very good start for beginners like me.
RanjithKumar chiguruvadaPosted Sep 28, 2012, 10:45 AM
This is a very good start for beginners like me.
Deepthi VijayakumarPosted Jun 14, 2012, 3:06 AM
Good article. How will you bind a collection in view model to item source of the chart?
RejitheditedPosted Sep 2, 2011, 5:41 AMEdited Sep 2, 2011, 5:44 AM
This is a very good start for beginners like me. But my requirement is also that the numbers should be dispalyed on the pie or the edge of the pie. Can you please tell me how that can be achieved
nikhil malhotraPosted May 20, 2011, 2:53 AM
this is very urgent please help me out
nikhil malhotraPosted May 20, 2011, 2:36 AM
How can i see value in right with right tabs like software engg value 12 then it shows like [Software Engg][12]
Hans GreifPosted Jul 14, 2010, 5:39 AM
Hi, trying Charts in WPF on Visual Studio 2008 and have got an error on ItemSource not in System.Windows.Controls.DataVisualidation.Charting.ISeries Regards
yu xiaofeiPosted May 7, 2010, 9:09 AM
Hi Mahesh Firstly,thanks for your article,it helps me a lot ,now I have a question that is how can you save the piechart you get to local.Looking forward your reply!Thank you! Best wishes!