

Introduction
In this article, we will be creating a graphical loan repayment calculator using Asp.net webforms, C#, and Javascript. It is important that when people are applying for loan, they should clearly understand how the loan will be repaid, in terms of installments, interest, total repayment amount, various effects of choosing between different repayment intervals, and many more.
Programming Language
Most of the coding will be done in javascript, we will then place the javascript code inside an asp.net webform.
Javascript that will be embedded into Aspx page
A. Let us first set up the initial variables
<script type="text/javascript">
//initial variables
var loanYear = 20;
var stepYear = 1;
var maxLoanYear = 30;
var paymentCycle = 1;
var monthlyRepayment = 0;
var monthlyInterest = 0;
var amortData = [];
B. Create startup method
 //start up method
 $(function() {
     $(".ul-buttons li").click(function() {
         $(".ul-buttons li").removeClass("selected");
         $(this).addClass("selected");
         paymentCycle = parseInt($(this).attr("data-value"));
         calculateLoan();
     });
     //Add on blur event
     $("#txtLoan, #txtInterest").on("blur", function() {
         //Perform a check if loan or interest value has been entered invalid value, if it is, set the default value
         if (isNaN($("#txtLoan").val())) {
             $("#txtLoan").val(1000000);
         }
         if (isNaN($("#txtInterest").val())) {
             $("#txtInterest").val(8.99);
         }
         calculateLoan();
     });
 });
C. Create the noUiSlider
//create the noUiSlider
var range = document.getElementById('yearRange');
noUiSlider.create(range, {
    range: {
        'min': 1,
        'max': maxLoanYear
    },
    step: stepYear,
    start: [loanYear],
    margin: 300,
    connect: true,
    direction: 'ltr',
    orientation: 'horizontal',
    pips: {
        mode: 'steps',
        stepped: false,
        density: 2
    }
});
//Add the change event to redraw the graph and calculate loan
range.noUiSlider.on("change", function(value) {
    loanYear = parseInt(value[0]);
    calculateLoan();
});
D. Create the Chart
 //Chart
 google.charts.load('current', {
     'packages': ['corechart']
 });

 function drawChart() {
     //Hold the loan data array
     var loanData = [];
     var dt = new Date();
     var yearCounter = 1;
     //Add the graph header
     var headerData = ['Year', 'Interest', 'Interest & Principal', 'Balance'];
     loanData.push(headerData);
     for (var i = dt.getFullYear(); i < dt.getFullYear() + loanYear; i++) {
         loanData.push([i.toString(), getAmortData("interest", 12 * yearCounter), monthlyRepayment * 12 * yearCounter, getAmortData("balance", 12 * yearCounter)]);
         yearCounter++;
     }
     var data = google.visualization.arrayToDataTable(loanData);
     var options = {
         title: 'Loan Chart',
         hAxis: {
             title: 'Year',
             titleTextStyle: {
                 color: '#333'
             }
         },
         vAxis: {
             minValue: 0
         },
         pointsVisible: true
     };
     var chart = new google.visualization.AreaChart(document.getElementById('graph-chart'));
     chart.draw(data, options);
 }
E. Get amortization data based on type and terms
function getAmortData(dataType, terms) {
    var dataValue = 0;
    switch (dataType) {
        case "interest":
            for (var i = 0; i < terms; i++) {
                dataValue += parseFloat(amortData[i].Interest);
            }
            break;
        case "balance":
            dataValue = parseFloat(amortData[terms - 1].Balance);
            break;
    }
    return Math.round(dataValue);
}
F. Create calculate function
//calculate function
function calculateLoan() {
    $("#year-value").html(loanYear);
    var loanBorrow = parseFloat($("#txtLoan").val());
    var interestRate = parseFloat($("#txtInterest").val()) / 1200;
    var totalTerms = 12 * loanYear;
    //Monthly
    var schedulePayment = Math.round(loanBorrow * interestRate / (1 - (Math.pow(1 / (1 + interestRate), totalTerms))));
    monthlyRepayment = schedulePayment;
    var totalInterestPay = totalTerms * schedulePayment;
    amort(loanBorrow, parseFloat($("#txtInterest").val()) / 100, totalTerms);
    switch (paymentCycle) {
        case 2:
            //Fortnightly
            //we multiple by 12 then divided by 52 then multiple by 2
            schedulePayment = Math.round(((schedulePayment * 12) / 52) * 2);
            break;
        case 3:
            //Weekly
            //we multiple by 12 then divided by 52
            schedulePayment = Math.round((schedulePayment * 12) / 52);
            break;
    }
    $("#repayment-value").html(schedulePayment);
    $("#interest-total").html(getAmortData("interest", totalTerms));
    monthlyInterest = (totalInterestPay - loanBorrow) / totalTerms;
    google.charts.setOnLoadCallback(drawChart);
}
calculateLoan();
//function to calculate the amortization data
function amort(balance, interestRate, terms) {
    amortData = [];
    //Calculate the per month interest rate
    var monthlyRate = interestRate / 12;
    //Calculate the payment
    var payment = balance * (monthlyRate / (1 - Math.pow(1 + monthlyRate, -terms)));
    for (var count = 0; count < terms; ++count) {
        var interest = balance * monthlyRate;
        var monthlyPrincipal = payment - interest;
        var amortInfo = {
            Balance: balance.toFixed(2),
            Interest: balance * monthlyRate,
            MonthlyPrincipal: monthlyPrincipal
        }
        amortData.push(amortInfo);
        balance = balance - monthlyPrincipal;
    }
} < /script>
G. Aspx Page with complete javascript inserted in.
<%@ Page Title="" Language="C#" MasterPageFile="~/Site.Master" AutoEventWireup="true" CodeBehind="loancalculator.aspx.cs" Inherits="cooperativesocietysoftware.loancalculator" %>
<asp:Content ID="Content1" ContentPlaceHolderID="MainContent" runat="server">
    <html>
<head>
    <title>Loan Calculator - </title>
    <meta name="viewport" content="width=device-width,initial-scale=1">
    <link href="https://fonts.googleapis.com/css?family=Roboto" rel="stylesheet">
    <link href="https://cdnjs.cloudflare.com/ajax/libs/noUiSlider/12.1.0/nouislider.css" rel="stylesheet">
    <script src="https://ajax.googleapis.com/ajax/libs/jquery/3.3.1/jquery.min.js"></script>
    <script type="text/javascript" src="https://cdnjs.cloudflare.com/ajax/libs/noUiSlider/12.1.0/nouislider.js"></script>
    <script type="text/javascript" src="https://www.gstatic.com/charts/loader.js"></script>
    <style>
        #loan-container {
            text-align: left;
            max-width: 1200px;
            margin: 20px auto;
            box-sizing: border-box;
            font-family: Roboto,Arial,sans-serif;
        }

        .box-pane {
            border: 1px solid #ddd;
            border-radius: 3px;
            padding: 25px;
            box-sizing: border-box;
            min-height: 570px;
        }

        #info-pane {
            float: left;
            width: 35%;
        }

        #graph-pane {
            float: right;
            width: 63%;
        }

        .heading-title {
            font-size: 1.35em;
            margin-bottom: 15px;
        }

        #repayment-total {
            float: left;
            width: 48%;
        }

        #repayment-cycle {
            width: 48%;
            float: right;
            text-align: right;
        }

        .row-input {
            margin-bottom: 20px;
        }

            .row-input label {
                padding: 5px 0;
                display: block;
            }

            .row-input input, .row-input select {
                background-color: #fff;
                border: 1px solid #ddd;
                padding: 9px 15px 10px;
                outline: none;
                border-radius: 5px;
                font-size: 1em;
            }

        .input-wrap {
            position: relative;
        }

        .currency-code {
            position: absolute;
            left: 3px;
            top: 9px;
        }

        .percentage-code {
            position: absolute;
            left: 75px;
            top: 9px;
        }

        .ul-buttons, .ul-buttons li {
            margin: 0;
            padding: 0;
            list-style: none;
        }

            .ul-buttons li {
                float: left;
                background-color: #f1f1f1;
                color: #6e6e6e;
                padding: 8px 25px;
                box-shadow: 0 2px 0 #ddd;
                cursor: pointer;
                font-size: 1rem;
                line-height: 1.5;
                width: 33%;
                float: left;
                box-sizing: border-box;
                text-align: center;
                border-left: solid 1px #ffffff;
                border-right: solid 1px #ffffff;
            }

                .ul-buttons li:hover, .ul-buttons li.selected {
                    background-color: #008094;
                    box-shadow: 0 2px 0 #006575;
                    color: #ffffff;
                }

        .note-text {
            font-size: 0.8em;
            font-style: italic;
            padding-top: 5px;
        }

        .range-slider {
            margin: 15px 0 65px 0;
        }

        .noUi-value {
            margin-top: 4px;
            font-size: 1em;
        }

        .short-input {
            width: 60px;
        }

        .bold {
            font-weight: normal;
        }

        .loan-value {
            font-size: 1.3em;
            font-weight: bold;
        }

        .orange-text {
            color: #f56a00;
        }

        #graph-chart {
            width: 100%;
            height: 450px;
        }

        .clear {
            clear: both;
        }

        @media screen and (max-width: 992px) {
            #info-pane, #graph-pane {
                float: none;
                width: 100%;
                margin-bottom: 20px;
            }

            .box-pane {
                min-height: 500px;
            }
        }
    </style>
</head>
<body>
    <div id="loan-container">
        <div id="info-pane" class="box-pane">
            <div class="heading-title bold">Calculate Your Loan.</div>
            <div class="row-input">
                <label>How much would you like to borrow?</label>
                <div class="input-wrap">
                    <div class="currency-code">N</div>
                    <input type="text" type="number" id="txtLoan" value="1000000" />
                </div>
            </div>
            <div class="row-input">
                <label>Loan interest rate?</label>
                <div class="input-wrap">
                    <div class="percentage-code">%</div>
                    <input type="text" type="number" id="txtInterest" value="8.99" maxlength="5" class="short-input" />
                </div>
            </div>
            <div class="row-input">
                <label>How many years would you like the loan for?</label>
                <div id="yearRange" class="range-slider"></div>
            </div>
            <div class="row-input">
                <label>How often would you like to make payments?</label>
                <ul class="ul-buttons">
                    <li class="selected" data-value="1">Monthly</li>
                    <li data-value="2">Fortnightly</li>
                    <li data-value="3">Weekly</li>
                </ul>
            </div>
        </div>
        <div id="graph-pane" class="box-pane">
            <div id="repayment-total">
                <div class="heading-title bold">Total interest</div>
                <div id="repayment-total-value" class="loan-value">
                    N<span id="interest-total">0</span> over <span class="orange-text"><span id="year-value">5</span> years</span>
                </div>
            </div>
            <div id="repayment-cycle">
                <div class="heading-title bold">Payment would be</div>
                <div id="repayment-cycle-value" class="loan-value">
                    N<span id="repayment-value">0</span> per <span class="orange-text">fortnight</span>
                </div>
            </div>

            <div class="clear"></div>
            <div id="graph-chart"></div>
        </div>
    </div>
<script type="text/javascript">
        //initial variables
        var loanYear = 20;
        var stepYear = 1;
        var maxLoanYear = 30;
        var paymentCycle = 1;
        var monthlyRepayment = 0;
        var monthlyInterest = 0;
        var amortData = [];

        //start up method
        $(function () {
            $(".ul-buttons li").click(function () {
                $(".ul-buttons li").removeClass("selected");
                $(this).addClass("selected");
                paymentCycle = parseInt($(this).attr("data-value"));
                calculateLoan();
            });

            //Add on blur event
            $("#txtLoan, #txtInterest").on("blur", function () {
                //Perform a check if loan or interest value has been entered invalid value, if it is, set the default value
                if (isNaN($("#txtLoan").val())) {
                    $("#txtLoan").val(1000000);
                }

                if (isNaN($("#txtInterest").val())) {
                    $("#txtInterest").val(8.99);
                }
                calculateLoan();
            });
        });

        //create the noUiSlider
        var range = document.getElementById('yearRange');
        noUiSlider.create(range, {
            range: {
                'min': 1,
                'max': maxLoanYear
            },
            step: stepYear,
            start: [loanYear],
            margin: 300,
            connect: true,
            direction: 'ltr',
            orientation: 'horizontal',
            pips: {
                mode: 'steps',
                stepped: false,
                density: 2
            }
        });

        //Add the change event to redraw the graph and calculate loan
        range.noUiSlider.on("change", function (value) {
            loanYear = parseInt(value[0]);
            calculateLoan();
        });

        //Chart
        google.charts.load('current', { 'packages': ['corechart'] });
        function drawChart() {
            //Hold the loan data array
            var loanData = [];

            var dt = new Date();
            var yearCounter = 1;

            //Add the graph header
            var headerData = ['Year', 'Interest', 'Interest & Principal', 'Balance'];
            loanData.push(headerData);

            for (var i = dt.getFullYear(); i < dt.getFullYear() + loanYear; i++) {
                loanData.push([i.toString(), getAmortData("interest", 12 * yearCounter), monthlyRepayment * 12 * yearCounter, getAmortData("balance", 12 * yearCounter)]);
                yearCounter++;
            }

            var data = google.visualization.arrayToDataTable(loanData);

            var options = {
                title: 'Loan Chart',
                hAxis: { title: 'Year', titleTextStyle: { color: '#333' } },
                vAxis: { minValue: 0 },
                pointsVisible: true
            };

            var chart = new google.visualization.AreaChart(document.getElementById('graph-chart'));
            chart.draw(data, options);
        }

        //Get amortization data based on type and terms
        function getAmortData(dataType, terms) {
            var dataValue = 0;
            switch (dataType) {
                case "interest":
                    for (var i = 0; i < terms; i++) {
                        dataValue += parseFloat(amortData[i].Interest);
                    }
                    break;
                case "balance":
                    dataValue = parseFloat(amortData[terms - 1].Balance);
                    break;
            }
            return Math.round(dataValue);
        }

        //calculate function
        function calculateLoan() {
            $("#year-value").html(loanYear);
            var loanBorrow = parseFloat($("#txtLoan").val());
            var interestRate = parseFloat($("#txtInterest").val()) / 1200;
            var totalTerms = 12 * loanYear;

            //Monthly
            var schedulePayment = Math.round(loanBorrow * interestRate / (1 - (Math.pow(1 / (1 + interestRate), totalTerms))));
            monthlyRepayment = schedulePayment;
            var totalInterestPay = totalTerms * schedulePayment;
            amort(loanBorrow, parseFloat($("#txtInterest").val()) / 100, totalTerms);

            switch (paymentCycle) {
                case 2:
                    //Fortnightly
                    //we multiple by 12 then divided by 52 then multiple by 2
                    schedulePayment = Math.round(((schedulePayment * 12) / 52) * 2);
                    break;
                case 3:
                    //Weekly
                    //we multiple by 12 then divided by 52
                    schedulePayment = Math.round((schedulePayment * 12) / 52);
                    break;
            }

            $("#repayment-value").html(schedulePayment);
            $("#interest-total").html(getAmortData("interest", totalTerms));
            monthlyInterest = (totalInterestPay - loanBorrow) / totalTerms;
            google.charts.setOnLoadCallback(drawChart);
        }

        calculateLoan();

        //function to calculate the amortization data
        function amort(balance, interestRate, terms) {
            amortData = [];

            //Calculate the per month interest rate
            var monthlyRate = interestRate / 12;

            //Calculate the payment
            var payment = balance * (monthlyRate / (1 - Math.pow(1 + monthlyRate, -terms)));

            for (var count = 0; count < terms; ++count) {
                var interest = balance * monthlyRate;
                var monthlyPrincipal = payment - interest;
                var amortInfo = {
                    Balance: balance.toFixed(2),
                    Interest: balance * monthlyRate,
                    MonthlyPrincipal: monthlyPrincipal
                }
                amortData.push(amortInfo);
                balance = balance - monthlyPrincipal;
            }

        }
    </script>
</body>
</html>
</asp:Content>
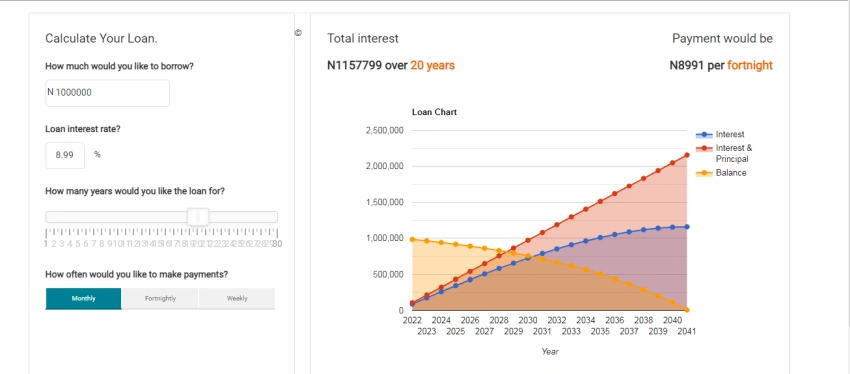
Final Output
Sola OshinowoPosted Nov 12, 2022, 9:21 AM
Hi Oli, its not in downloadable form, but the full source code is in the article.
OliPosted Nov 3, 2022, 4:05 PM
Where can I download the full source code?
Sola OshinowoPosted Apr 20, 2022, 11:04 PM
Hi Fed, apologies for the late reply. I presume you are referring to N in total interest amount value, and payment would be value. In the full code, that is inside the aspx page, go to line 207, you will see the code N<span id="interest-total">0</span> over <span class="orange-text"><span remove the N and you can replace it with your country's currency symbol. Also you need to go to line 213 , look for the code N<span id="repayment-value">0</span> per <span class="orange-text">fortnight</span> ,if you didn't alter the code at all, then you will find it on the line numbers mentioned, but if you did, then you can copy the code snippet and find the occurrence of it in the page. Thank you
fred jamesonPosted Apr 6, 2022, 1:40 PM
This program is timely, thank you. I have one question, how do i remove the N symbol ?
Mahesh ChandPosted Jan 28, 2022, 1:55 PM
Is this different than a Loan Payment Calculator? Would love to see an article on that. So many questions and searches on loan payment calculator with adjusted time and interest rate.
Radha KrishnaPosted Jan 15, 2022, 10:42 AM
Thanks bro... its work properly.. Thanks again
Sola OshinowoPosted Jan 15, 2022, 10:21 AM
Radha Krishna, the files have been sent to your email, do let me know in the comment section whether you were able to view the front end.
Sola OshinowoPosted Jan 15, 2022, 9:56 AM
Radha Krishna, the article as been updated, you can copy the aspx section in here.
Sola OshinowoPosted Jan 14, 2022, 7:34 PM
Send me your email address
Sola OshinowoPosted Jan 14, 2022, 11:00 AM
The code is to be inserted into either a html page or asp.net webform, immediately this is done, the front end will become visible. Are you farmiliar with basic html (DOM) or Asp.net webform aspx page?
Radha KrishnaPosted Jan 14, 2022, 10:45 AM
Where i get the front end design..?
john akenaPosted Jan 8, 2022, 4:39 PM
So, I followed the article and was able to come up with a graphical loan calculator. Thank you soo much. Please can you come up with a similar article but for a Loan repayment table?
john akenaPosted Jan 4, 2022, 10:14 AM
Thank you for this article, been looking for something like this for a while, i will try it out.