On a bootstrap based web page I'm displaying the following table
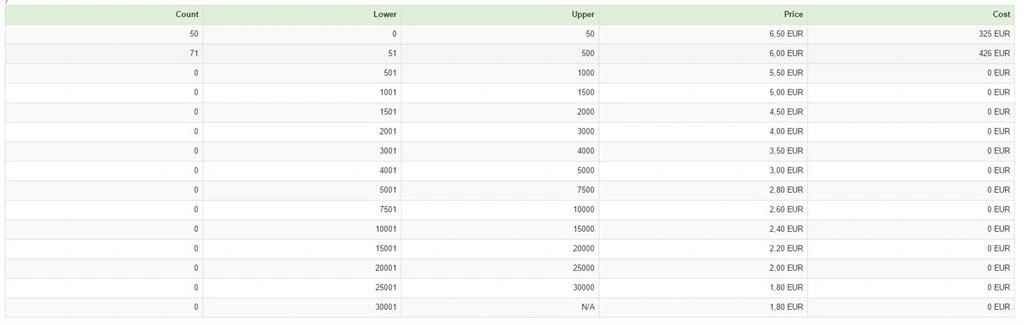
This was generated with the following code:
-
-
-
-
-
- @foreach (var dataRow in staffelData)
- {
- var differenceWithUpper = 0;
- if (dataRow.Upper.HasValue)
- {
- differenceWithUpper = countValue - dataRow.Upper.Value;
- }
- else
- {
- differenceWithUpper = -1;
- }
- var cost = 0.0;
- var inScope = 0;
- if (differenceWithUpper >= 0)
- {
- inScope = dataRow.Upper.Value;
- }
- else
- {
- if (countValue >= dataRow.Lower.Value)
- {
- inScope = countValue - dataRow.Lower.Value;
- }
- }
- cost = inScope * Decimal.ToDouble(@dataRow.PnrFee);
- @if (@dataRow.Lower.HasValue)
- {
- }
- else
- {
- }
- @if (@dataRow.Upper.HasValue)
- {
- }
- else
- {
- }
- }
- )
Vinay SinghPosted Jul 6, 2016, 4:25 AM
Olivier MuhringPosted Jul 6, 2016, 4:09 AM
The idea is not to display the average value, but an estimated, expected value based on the average.
Say we have on average 25 orders per day then at day 10 I would expect 250 orders. This is the value I want to display as a thin red line on the table.
Pradeep ShetPosted Jul 6, 2016, 12:55 AM
tag for a line