

Introduction
- Client-Side Chart Widget in HTML 5: Part 1 (Bar Chart)
- Client-Side Chart Widget in HTML 5: Part 2 (Pie Chart)
- Client-Side Chart Widget in HTML 5: Part 3 (Line Chart)
- Client-Side Chart Widget in HTML 5: Part 4 (Doughnut Chart)
- Client-Side Chart Widget in HTML 5: Part 5 (Polar Area Chart)
- Client-Side Chart Widget in HTML 5: Part 6 (Radar Chart)
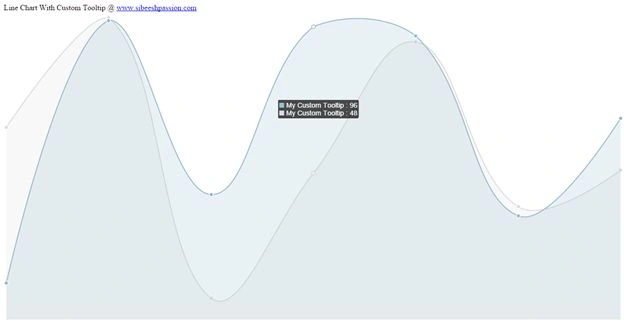
Now we will explain a client Line Chart widget with custom tooltip in HTML5.
Background
Please download the necessary files here.
Using the code
A simple HTML
- <!DOCTYPE html>
- <html xmlns="http://www.w3.org/1999/xhtml">
- <head>
- <title> Line Chart widget with custom tooltip Using Chart.js</title>
- </head>
- <body></body>
- </html>
- <script src="Chart.js"></script>
- <script src="http://cdnjs.cloudflare.com/ajax/libs/jquery/2.1.3/jquery.min.js"></script>
- window.onload = function () {
- var ctx1 = document.getElementById("myChart").getContext("2d");
- window.myLine = new Chart(ctx1).Line(lineChartData, {
- showScale: false,
- pointDot: true,
- responsive: true
- });
- };
- var lineChartData = {
- labels: ["Monday", "Tuesday", "Wednesday", "Thursday", "Friday", "Saturday", "Sunday"],
- datasets: [{
- label: "My First dataset",
- fillColor: "rgba(220,220,220,0.2)",
- strokeColor: "rgba(220,220,220,1)",
- pointColor: "rgba(220,220,220,1)",
- pointStrokeColor: "#fff",
- pointHighlightFill: "#fff",
- pointHighlightStroke: "rgba(220,220,220,1)",
- data: [randomScalingFactor(), randomScalingFactor(), randomScalingFactor(), randomScalingFactor(), randomScalingFactor(), randomScalingFactor(), randomScalingFactor()]
- }, {
- label: "My Second dataset",
- fillColor: "rgba(151,187,205,0.2)",
- strokeColor: "rgba(151,187,205,1)",
- pointColor: "rgba(151,187,205,1)",
- pointStrokeColor: "#fff",
- pointHighlightFill: "#fff",
- pointHighlightStroke: "rgba(151,187,205,1)",
- data: [randomScalingFactor(), randomScalingFactor(), randomScalingFactor(), randomScalingFactor(), randomScalingFactor(), randomScalingFactor(), randomScalingFactor()]
- }]
- };
- Labels
- Datasets
- label ( label for your dataset)
- fillColor
- strokeColor
- pointColor
- pointStrokeColor
- pointHighlightFill
- pointHighlightStroke
- data
Here you can change the properties as you want.
Now add the following style for our tooltip:
- <style>
- #chartjs-tooltip {
- opacity: 1;
- position: absolute;
- background: rgba(0, 0, 0, .7);
- color: white;
- padding: 3px;
- border-radius: 3px;
- -webkit-transition: all .1s ease;
- transition: all .1s ease;
- pointer-events: none;
- -webkit-transform: translate(-50%, 0);
- transform: translate(-50%, 0);
- }
- .chartjs-tooltip-key {
- display: inline-block;
- width: 10px;
- height: 10px;
- }
- </style>
- Chart.defaults.global.pointHitDetectionRadius = 1;
- Chart.defaults.global.customTooltips = function (tooltip) {
- var tooltipEl = $('#chartjs-tooltip');
- if (!tooltip) {
- tooltipEl.css({
- opacity: 0
- });
- return;
- }
- tooltipEl.removeClass('above below');
- tooltipEl.addClass(tooltip.yAlign);
- var innerHtml = '';
- for (var i = tooltip.labels.length - 1; i >= 0; i--) {
- innerHtml += [
- '<div class="chartjs-tooltip-section">',
- ' <span class="chartjs-tooltip-key" style="background-color:' + tooltip.legendColors[i].fill + '"></span>',
- ' <span class="chartjs-tooltip-value">' + 'My Custom Tooltip : '+ tooltip.labels[i] + '</span>',
- '</div>'
- ].join('');
- }
- tooltipEl.html(innerHtml);
- tooltipEl.css({
- opacity: 1,
- left: tooltip.chart.canvas.offsetLeft + tooltip.x + 'px',
- top: tooltip.chart.canvas.offsetTop + tooltip.y + 'px',
- fontFamily: tooltip.fontFamily,
- fontSize: tooltip.fontSize,
- fontStyle: tooltip.fontStyle,
- });
- };
- <!doctype html>
- <html>
- <head>
- <title>Line Chart with Custom Tooltips</title>
- <script src="Chart.js"></script>
- <script src="http://cdnjs.cloudflare.com/ajax/libs/jquery/2.1.3/jquery.min.js"></script>
- <style>
- #canvas-holder1 {
- width: 300px;
- margin: 20px auto;
- }
- #chartjs-tooltip {
- opacity: 1;
- position: absolute;
- background: rgba(0, 0, 0, .7);
- color: white;
- padding: 3px;
- border-radius: 3px;
- -webkit-transition: all .1s ease;
- transition: all .1s ease;
- pointer-events: none;
- -webkit-transform: translate(-50%, 0);
- transform: translate(-50%, 0);
- }
- .chartjs-tooltip-key {
- display: inline-block;
- width: 10px;
- height: 10px;
- }
- </style>
- </head>
- <body>
- <div>
- Line Chart With Custom Tooltip @ <a href="www.sibeeshpassion.com">www.sibeeshpassion.com</a>
- <canvas id="myChart"></canvas>
- </div>
- <div id="chartjs-tooltip"></div>
- <script>
- Chart.defaults.global.pointHitDetectionRadius = 1;
- Chart.defaults.global.customTooltips = function (tooltip) {
- var tooltipEl = $('#chartjs-tooltip');
- if (!tooltip) {
- tooltipEl.css({
- opacity: 0
- });
- return;
- }
- tooltipEl.removeClass('above below');
- tooltipEl.addClass(tooltip.yAlign);
- var innerHtml = '';
- for (var i = tooltip.labels.length - 1; i >= 0; i--) {
- innerHtml += [
- '<div class="chartjs-tooltip-section">',
- ' <span class="chartjs-tooltip-key" style="background-color:' + tooltip.legendColors[i].fill + '"></span>',
- ' <span class="chartjs-tooltip-value">' + 'My Custom Tooltip : '+ tooltip.labels[i] + '</span>',
- '</div>'
- ].join('');
- }
- tooltipEl.html(innerHtml);
- tooltipEl.css({
- opacity: 1,
- left: tooltip.chart.canvas.offsetLeft + tooltip.x + 'px',
- top: tooltip.chart.canvas.offsetTop + tooltip.y + 'px',
- fontFamily: tooltip.fontFamily,
- fontSize: tooltip.fontSize,
- fontStyle: tooltip.fontStyle,
- });
- };
- var randomScalingFactor = function () {
- return Math.round(Math.random() * 100);
- };
- var lineChartData = {
- labels: ["Monday", "Tuesday", "Wednesday", "Thursday", "Friday", "Saturday", "Sunday"],
- datasets: [{
- label: "My First dataset",
- fillColor: "rgba(220,220,220,0.2)",
- strokeColor: "rgba(220,220,220,1)",
- pointColor: "rgba(220,220,220,1)",
- pointStrokeColor: "#fff",
- pointHighlightFill: "#fff",
- pointHighlightStroke: "rgba(220,220,220,1)",
- data: [randomScalingFactor(), randomScalingFactor(), randomScalingFactor(), randomScalingFactor(), randomScalingFactor(), randomScalingFactor(), randomScalingFactor()]
- }, {
- label: "My Second dataset",
- fillColor: "rgba(151,187,205,0.2)",
- strokeColor: "rgba(151,187,205,1)",
- pointColor: "rgba(151,187,205,1)",
- pointStrokeColor: "#fff",
- pointHighlightFill: "#fff",
- pointHighlightStroke: "rgba(151,187,205,1)",
- data: [randomScalingFactor(), randomScalingFactor(), randomScalingFactor(), randomScalingFactor(), randomScalingFactor(), randomScalingFactor(), randomScalingFactor()]
- }]
- };
- window.onload = function () {
- var ctx1 = document.getElementById("myChart").getContext("2d");
- window.myLine = new Chart(ctx1).Line(lineChartData, {
- showScale: false,
- pointDot: true,
- responsive: true
- });
- };
- </script>
- </body>
- </html>
Conclusion
Kindest Regards
Sibeesh
Sibeesh VenuPosted Feb 7, 2015, 11:27 AM
Manish Kumar Choudhary Thanks a lot buddy
Sibeesh VenuPosted Feb 7, 2015, 11:27 AM
Praveen Kumar Thank you
Manish Kumar ChoudharyPosted Feb 7, 2015, 11:16 AM
Nice one buddy. .
Praveen KumarPosted Feb 7, 2015, 8:52 AM
Very nice