

Introduction
- <!DOCTYPE html>
- <html xmlns="http://www.w3.org/1999/xhtml">
- <head>
- <title>Bar Chart Using Chart.js</title>
- </head>
- <body></body>
- </html>
- <script src="Chart.js"></script>
- window.onload = function () {
- var canvasObject = document.getElementById("myChart").getContext("2d");
- window.myBar = new Chart(canvasObject).Bar(barChartData, {
- responsive: true
- });
- }
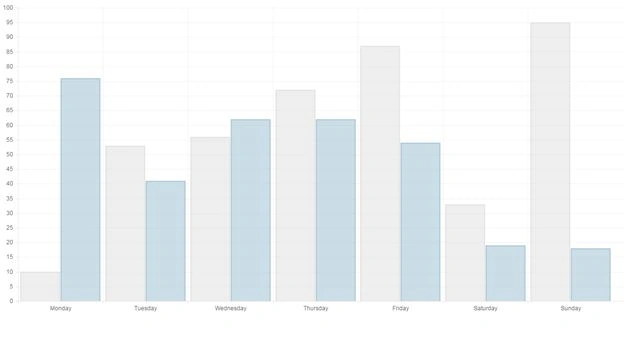
- var barChartData = {
- labels: ["Monday", "Tuesday", "Wednesday", "Thursday", "Friday", "Saturday", "Sunday"],
- datasets: [
- {
- fillColor: "rgba(220,220,220,0.5)",
- strokeColor: "rgba(220,220,220,0.8)",
- highlightFill: "rgba(220,220,220,0.75)",
- highlightStroke: "rgba(220,220,220,1)",
- data: [scalingFactor(), scalingFactor(), scalingFactor(), scalingFactor(), scalingFactor(), scalingFactor(), scalingFactor()]
- },
- {
- fillColor: "rgba(151,187,205,0.5)",
- strokeColor: "rgba(151,187,205,0.8)",
- highlightFill: "rgba(151,187,205,0.75)",
- highlightStroke: "rgba(151,187,205,1)",
- data: [scalingFactor(), scalingFactor(), scalingFactor(), scalingFactor(), scalingFactor(), scalingFactor(), scalingFactor()]
- }
- ]
- }
- Labels
- Datasets
- fillColor
- strokeColor
- highlightFill
- highlightStroke
- data
Here you can change the properties as you want.
Use the following to generate data:
- var scalingFactor = function () { return Math.round(Math.random() * 100) };
- <!DOCTYPE html>
- <html xmlns="http://www.w3.org/1999/xhtml">
- <head>
- <title>Bar Chart Using Chart.js</title>
- <script src="Chart.js"></script>
- <script>
- var scalingFactor = function () { return Math.round(Math.random() * 100) };
- var barChartData = {
- labels: ["Monday", "Tuesday", "Wednesday", "Thursday", "Friday", "Saturday", "Sunday"],
- datasets: [
- {
- fillColor: "rgba(220,220,220,0.5)",
- strokeColor: "rgba(220,220,220,0.8)",
- highlightFill: "rgba(220,220,220,0.75)",
- highlightStroke: "rgba(220,220,220,1)",
- data: [scalingFactor(), scalingFactor(), scalingFactor(), scalingFactor(), scalingFactor(), scalingFactor(), scalingFactor()]
- },
- {
- fillColor: "rgba(151,187,205,0.5)",
- strokeColor: "rgba(151,187,205,0.8)",
- highlightFill: "rgba(151,187,205,0.75)",
- highlightStroke: "rgba(151,187,205,1)",
- data: [scalingFactor(), scalingFactor(), scalingFactor(), scalingFactor(), scalingFactor(), scalingFactor(), scalingFactor()]
- }
- ]
- }
- window.onload = function () {
- var canvasObject = document.getElementById("myChart").getContext("2d");
- window.myBar = new Chart(canvasObject).Bar(barChartData, {
- responsive: true
- });
- }
- </script>
- </head>
- <body>
- <div>
- <canvas id="myChart"></canvas>
- </div>
- </body>
- </html>
Conclusion
Sibeesh VenuPosted Jan 24, 2015, 9:33 PM
abolfazl roshanzamir Thank you.
Arweb AroshanzamirPosted Jan 24, 2015, 3:59 PM
very informative.. thanks sir