Updates: 8/20/2003
- Fixed Flickering via Double Buffering - Thanks to Robert Rohde for pointing it out.
- Added TickMark.Diamond and TickMark.Bowtie to TickMarks Enum.
- Added VerticalBarChart (Beta) as a new Charting Control.
Introduction
I started this project a month or two ago while learning C# (being Unemployed helped with the free time). I was amazed at what the VS.NET IDE does for a programmer as I was primarily used to Java via the command line. I decided to make something fairly complex and useful so that all of my time learning would not be wasted, and so here we have SeabeckCharts. I also initially intended to sell these controls, but I dont have the money at this time to start another company and procure the proper licenses etc. to do it legally here in the *great* State of Maryland, so I am giving it to you all for free (Donations are welcome though, but not expected.).
Basics
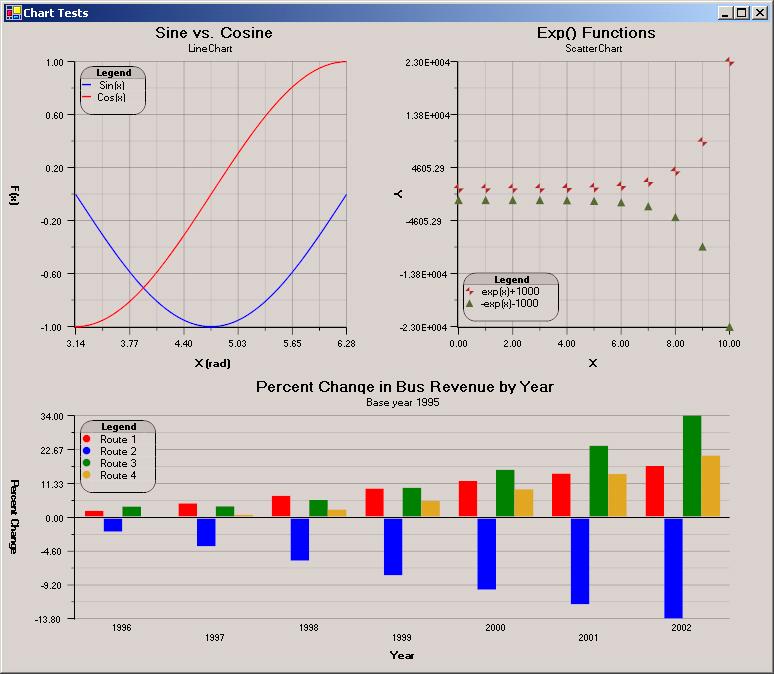
Initially I intended to include many more chart types, and these may come in time, but for now I have only included a LineChart and a ScatterChart as Custom User Controls. Features common to both Charts include:
Title
- SubTitle
- X and Y Labels
- Legend
- Data Series - Colors, TickMarks, Smoothing
- Backgrounds
- Text Properties - Font, Size, Color
- Dynamic Charting - Add or Remove Series Interactively, Mouse Clickable to display Point Coordinates
Use
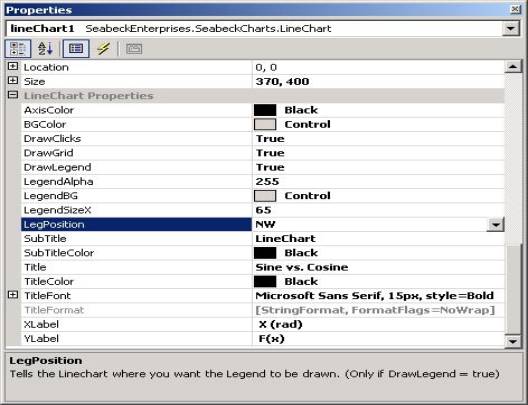
To use the charts, simply customize the toolbox (by right-clicking on it and choosing Customize Toolbox, then on the .NET Framework Components Tab choose Browse) and add SeabeckEnterprises.dll to it. You should now have 2 more Controls in the toolbox, LineChart and ScatterChart. You can drag these on to any form you create, and Customize them either by right-clicking on them and choosing Properties (In the Categorized Properties View, the properties will be listed under LineChart Properties or ScatterChart Properties for each respective Chart.), or in the Code View of the Form.
Next, all you have to do is add Data to the chart(s). You can see how this is done in the ChartsTest.zip solution. Here is a small Example :
//LineChart Data
double[] x1 = new double[101];
double[] y1 = new double[101];
double[] y2 = new double[101];
//ScatterChart Data
double[] x3 = new double[11];
double[] y3 = new double[11];
double[] y4 = new double[11];
//Values for LineChart
for(int i=0;i<x1.Length;i++)
{
x1[i] = Math.PI + (((double)i)*(Math.PI/100.0));
y1[i] = Math.Sin(x1[i]);
y2[i] = Math.Cos(x1[i]);
}
//Values for ScatterChart
for(int j=0;j<y3.Length;j++)
{
x3[j] = j;
y3[j] = Math.Exp(x3[j])+1000;
y4[j] = -Math.Exp(x3[j])-1000;
}
this.lineChart1.SetXValues(x1);
this.lineChart1.AddSeries("Sin(x)",Color.Blue,1.5f,false,true,TickMark.Dot,y1);
this.lineChart1.AddSeries("Cos(x)",Color.Red,1.55f,true,true,TickMark.Plus,y2);
this.scatterChart1.SetXValues(x3);
this.scatterChart1.AddSeries("exp(x) + 1000",Color.Firebrick,2.5f,TickMark.Triangle,y3);
this.scatterChart1.AddSeries("-exp(x)-1000",Color.DarkOliveGreen,3.5f,TickMark.Dot,y4);
Another Project I used this graphing library for is a Memory and Cache Benchmark called MemBurn which can be found at http://www.seabeck-enterprises.com .
Issues / Missing Features / Bugs
I havent found any issues or bugs so far that I havent already fixed. Of Course Im sure some of you that use the Controls will find some, and I hope that you will email me at one of the addresses below to let me know. Of course you can fix/change/add anything you want to the code, but Id appreciate it especially for bugs if youd let me know.
There are some desirable features that arent implemented yet. The Charts as they stand now ALWAYS auto-scale both Axes. I understand that it is useful to be able to manually control the ranges of the Axes, and I may implement that soon if I continue to not have a job. :) Also, multiple Y-Axes are useful in some situations, and I will look into that as well as time permits.