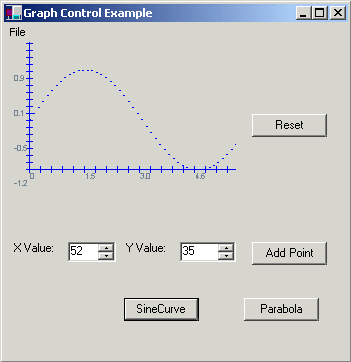
One of the wonderful features in C# is it is finally easy to create components.
One of the wonderful features in C# is it is finally easy to create components. No more of these exhaustive MFC or ATL libraries with all the intricacies that no one really needs to know. To create a component in C#, simply expose your properties and methods as public (just like you do in VB). In this example we have an XYGraph Component and a form that uses it.

XYGraph.cs contains the code for the graph component. The OnPaint Function is overridden in the control to display the graph:
protected override void OnPaint( PaintEventArgs pe )
{
Graphics g = pe.Graphics;
Pen myPen = new Pen( Color.Blue, 1 );
Rectangle rect = this.ClientRectangle;
DrawXAxis(g);
DrawYAxis(g);
if (m_nNumberOfPoints > 0)
{
if (m_bConnectPoints && m_nNumberOfPoints > 1)
{
for (int i = m_nNumberOfPoints; i < 100; i++)
{
// for now just set all the rest of the points to the last point
m_points[i] = m_points[m_nNumberOfPoints - 1];
}
g.DrawLines(myPen, m_points);
}
else
{
for (int i = 0; i < m_nNumberOfPoints; i++)
{
g.DrawLine(myPen, m_points[i].X, m_points[i].Y, m_points[i].X + 1, m_points[i].Y);
}
}
}
myPen.Dispose();
}
Looking further at the code you can also see quite a few properties defined. These properties will show up in the properties window when you are in design mode in the Visual Studio.NET editor. The code for the property ConnectPointsFlag used to determine if the graph should connect the points of the graph is shown below:
private bool m_bConnectPoints = false;
public bool ConnectPointsFlag
{
get
{
return m_bConnectPoints;
}
set
{
m_bConnectPoints = value;
}
}
Note we need to declare a separate private boolean flag, m_bConnectPoints, to use in our internal code of the property. The value keyword automatically assigns whatever is passed to the modifier part of the property to the connection point flag m_bConnectPoints.
We have created a separate application, WindowsApplication5.exe to execute are component. One of the buttons displays a sine curve, making use of the System.Math library. Below is the function called in the form when the SineCurve button is pressed:
protected void button2_Click (object sender, System.EventArgs e)
{
xyGraphControl2.Reset();
// set up the graph parameters
xyGraphControl2.XTickValue = 6.28f/225f;
xyGraphControl2.YTickValue = 0.02f;
xyGraphControl2.XOrigin = 0;
xyGraphControl2.YOrigin = -1;
// draw the points on the graph
for (float i = 0; i < 6.28; i += 6.28f/50f)
{
xyGraphControl2.AddPoint(i, (float)Math.Sin((double)i));
}
// force the graph to redraw
xyGraphControl2.Invalidate();
}
The sine function has a full cycle at 2p or approximately 6.28. We've set our tick increments equal to (the sine cycle)/(length of the component in pixels). The sine curve has an amplitude of 1 and -1, so we set the y axis tick mark to 1/(approx length of the component). You may want to experiment and change the tick to a calculation such as XTickValue = 2/xyGraphControl2.ClientRectangle.Width. The AddPoint function sets all the necessary properties needed to add a point to the Graph. Currently the component is limited to 100 points, but some inspired coder could improve this greatly using ArrayLists or dynamic arrays.