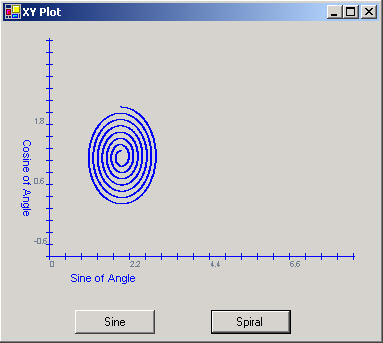
Figure 1 - The XYPlot Control used in a Form
This is a follow up of the article written originally for the beta version of .NET called, A Graphics Component in C#. There are some slight modifications to this control to use an ArrayList rather than a one-dimensional array. By using an ArrayList, the list of points can grow dynamically rather than having to predetermine the number of points. The controls interface remains the same, so you can use it the same way as the previous article describes.
Utilizing the ArrayList
The ArrayList is like an array, except it stores generic objects. For the purpose of plotting, I created a generic Point class, called PointI. Originally I tried to store the System.Drawing.Point struct in the ArrayList, but I had trouble pulling the point out of the list without getting a copy of it, so I couldn't assign anything to the X and Y values. This may have been something I was doing wrong, but a class reference worked better. The PointI class is a subset of the Point struct and is used the same way throughout the code as a Point. It can even be converted to a Point struct with the ToPoint() method. Below is the code used to add a point to the list of points to be plotted in the user control
public void AddPoint(float x, float y)
{
// Add a new point to the ArrayList
m_points.Add(new PointI());
XValue = x;
YValue = y;
CurrentIndex ++;
NumberOfPoints ++;
}
Listing 1 - Adding a Point to the PointI ArrayList
As you may have guessed, m_points is the ArrayList and accepts the PointI instance into its collection via the Add method. XValue and YValue are actually properties and do a bit more than get assigned x and y values. The XValue and YValue properties also assign the current values to the newly created point in the m_points ArrayList. In addition, the XValue and YValue properties translate the coordinate system on the graph into the coordinate system on the user control. When the x and y values are read from these properties with a get, they translate the coordinates from the screen back to the graph coordinates. Below is the XValue property code:
public float XValue
{
get
{
// get the actual point that is sitting on the graph
return (float)(UntranslateX(((PointI)m_points[m_nCurrentIndex]).X) * m_fXTickValue + XOrigin);
}
set
{
// set the point to translated screen coordinates
PointI p = ((PointI)m_points[m_nCurrentIndex]);
p.X = TranslateX((int)((value- XOrigin)/m_fXTickValue));
}
}
Listing 2 - XValue Property for translating between screen and graph coordinates
Notice that the indexed elements in the ArrayList must be unboxed each time you want to access properties or methods of the PointI class.
To use the control, you just set up the origin and tick values as was done in the previous article. You can also set Axis Labels in this version. Below is the code for creating a graph of the spiral shown in Figure 1.
private void SpiralButton_Click(object sender, System.EventArgs e)
{
xyGraphControl1.Reset();
xyGraphControl1.XTickValue = 6.28f/225f;
xyGraphControl1.YTickValue = 0.02f;
xyGraphControl1.XOrigin = 0;
xyGraphControl1.YOrigin = -1;
// Create a spiral by plotting a circle with sine and cosine of the angle and reducing the radius slightly each time
// through the loop
for (float i = 0; i < 6.28 * 7; i += 6.28f/500f)
{
xyGraphControl1.AddPoint((float)Math.Sin((double)i) *(1- i/50.0f) + 2.0f,
(float)Math.Cos((double)i)* (1 - i/50.0f) + 1.0f);
}
xyGraphControl1.Invalidate();
}
Listing 3 - Plotting a Spiral on the XY Plot user control