

Introduction
This blog will explain how to implement Google Combo Chart with the Angular 2+ version. I have used Angular version 7 here. NPM provides Google Charts, an open source library which is based on JavaScript. Google Charts is a graphical visualization which represents your data in the chart format.
Here are the steps to be followed in order to implement Google Combo Charts with Angular.
Step 1
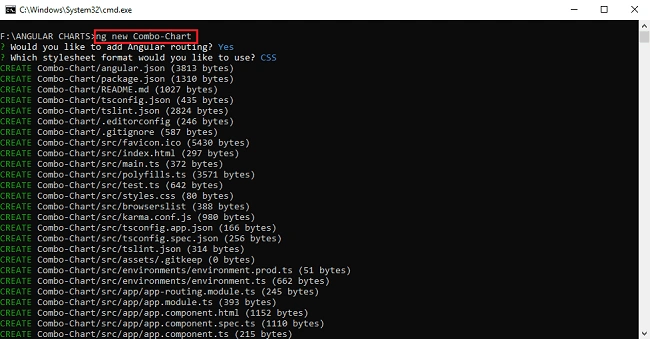
Create a new project using Angular CLI. Open the command prompt and execute the following command.
- ng new Combo-Chart
Step 2
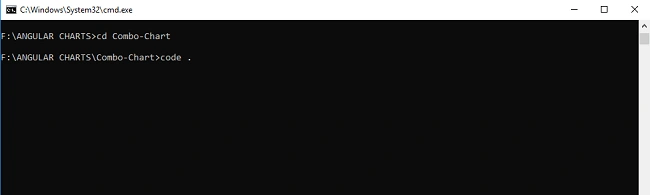
Open the project in Visual Studio Code.
- cd Combo-Chart
- code .
Step 3
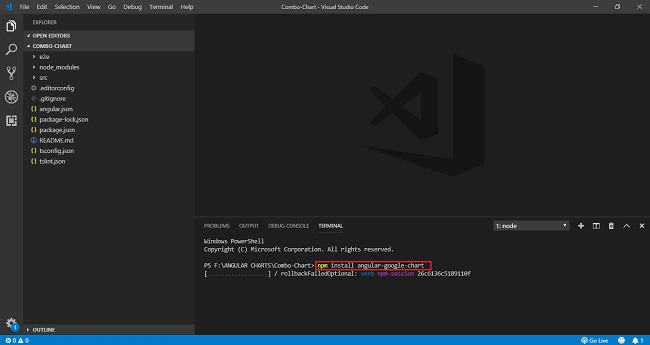
Open terminal from the Terminal tab in Visual Studio Code and install Google Charts library in your project.
- npm install angular-google-charts
Step 4
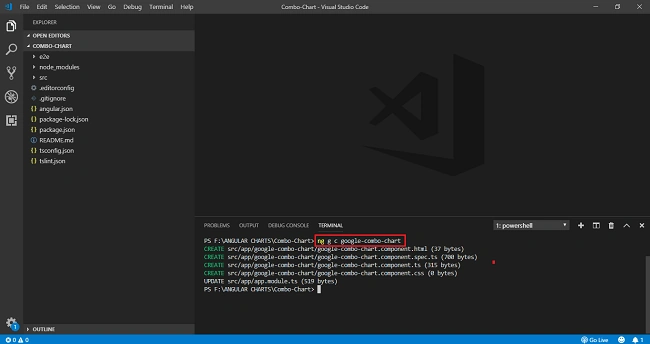
Create a google-combo-column-chart component.
- ng g c google-combo-chart
Step 5
Open the app-module.ts and import Google Charts.
- import { BrowserModule } from '@angular/platform-browser';
- import { NgModule } from '@angular/core';
- import { GoogleChartsModule } from 'angular-google-charts';
- import { AppRoutingModule } from './app-routing.module';
- import { AppComponent } from './app.component';
- import { GoogleComboChartComponent } from './google-combo-chart/google-combo-chart.component';
- @NgModule({
- declarations: [
- AppComponent,
- GoogleComboChartComponent
- ],
- imports: [
- BrowserModule,
- AppRoutingModule,
- GoogleChartsModule
- ],
- providers: [],
- bootstrap: [AppComponent]
- })
- export class AppModule { }
Step 6
Open the google-combo-chart-compnent.ts file and add the below code.
- import { Component, OnInit } from '@angular/core';
- @Component({
- selector: 'app-google-combo-chart',
- templateUrl: './google-combo-chart.component.html',
- styleUrls: ['./google-combo-chart.component.css']
- })
- export class GoogleComboChartComponent implements OnInit {
- constructor() { }
- title = 'Company Hiring Report';
- type = 'ComboChart';
- data = [
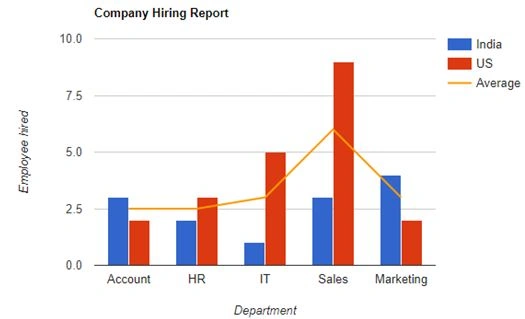
- ["Account", 3, 2, 2.5],
- ["HR",2, 3, 2.5],
- ["IT", 1, 5, 3],
- ["Sales", 3, 9, 6],
- ["Marketing", 4, 2, 3]
- ];
- columnNames = ['Loaction','India','US','Average'];
- options = {
- hAxis: {
- title: 'Department'
- },
- vAxis:{
- title: 'Employee hired'
- },
- seriesType: 'bars',
- series: {2: {type: 'line'}}
- };
- width = 600;
- height = 400;
- ngOnInit() {
- }
- }
Step 7
Open the google-combo-chart-compnent.html file and add the following code.
- <google-chart #chart
- [title]="title"
- [type]="type"
- [data]="data"
- [columnNames]="columnNames"
- [options]="options"
- [width]="width"
- [height]="height">
- </google-chart>
Step 8
Open the app-compnent.html file and add the below code.
- <app-google-combo-chart></app-google-combo-chart>
Step 9
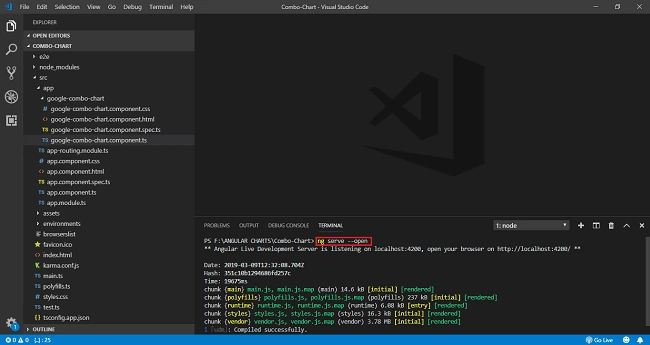
Run and open your project.
- ng serve –open
Project Output
Chittaranjan SwainPosted Aug 18, 2019, 10:51 PM
Nice article.