
Highcharts is a JavaScript library for charting. It draws beautiful charts with a variety of chart options and CSS options and is interactive with dynamic charts and animations. We will be using Highcharts in MVC.
Please visit the following URL for all the chart demos of Highcharts:
http://www.highcharts.com/demo/
You will get all the chart options.
Approach I: To use these charts in MVC we just need a JavaScript file and provide appropriate data.
Approach II: Another option is using the DotNet.HighChart DLL and creating object of Highcharts in the controller and setting all the properties and return this object to the view for rendering.
For this approach please visit the following URL and download the code for the implementation of this approach.
https://dotnethighcharts.codeplex.com/
We will now begin for the first approach. I will create a sample Transport database and a table with vehicle category. We will display the pie chart with the vehicle type with their number as shown below: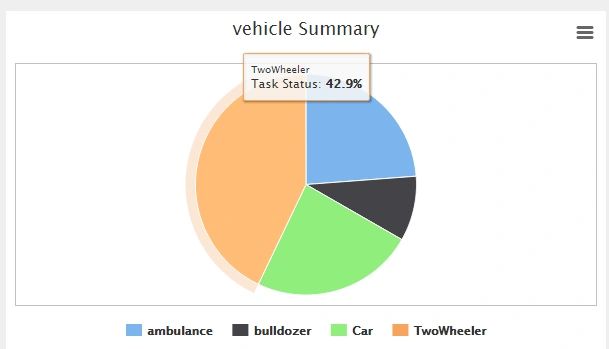
With the option to export this chart: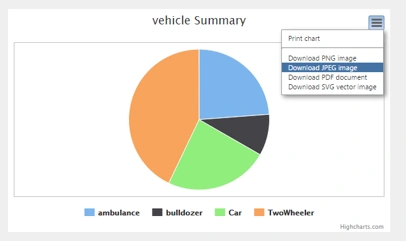
Create a MVC internet project.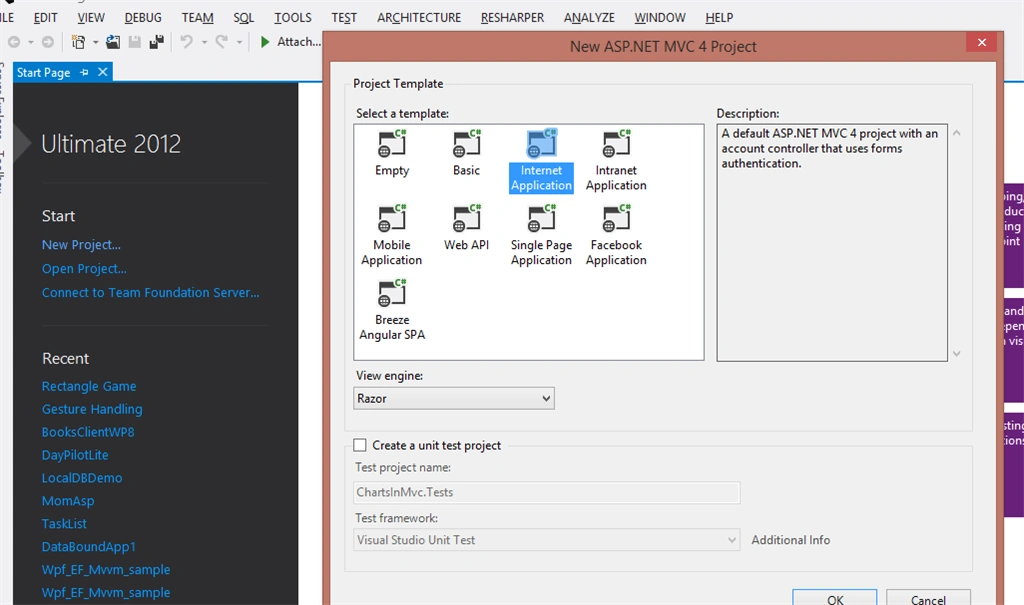
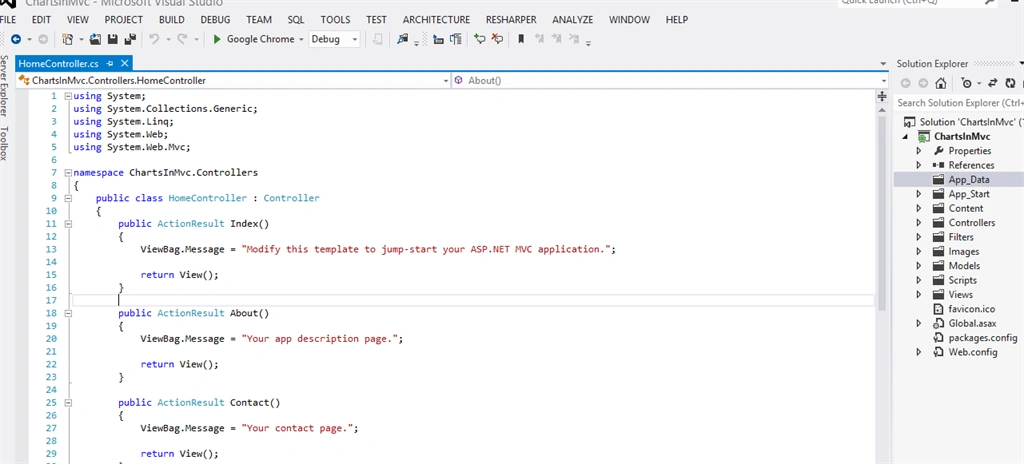
Let's create a database and a table with some sample data:
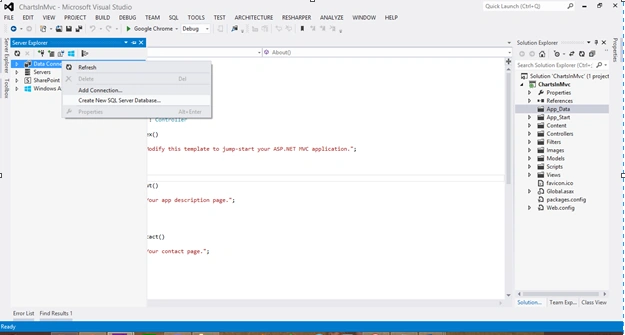
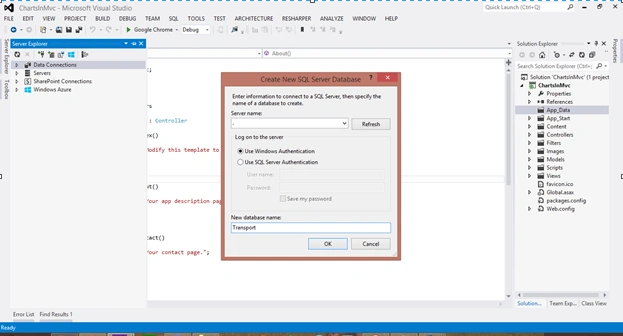
After the database is created, expand the database and add a table.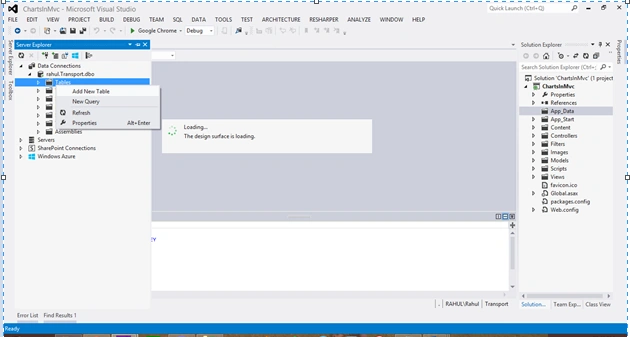
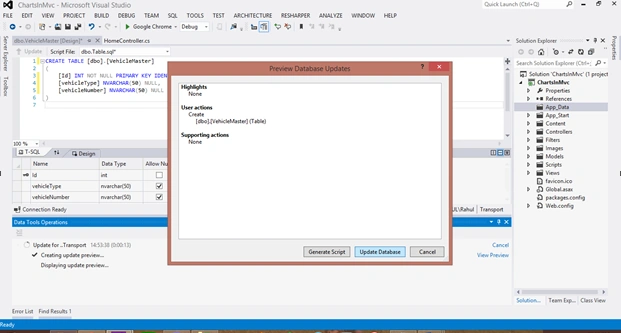
Now add three columns or use the following script: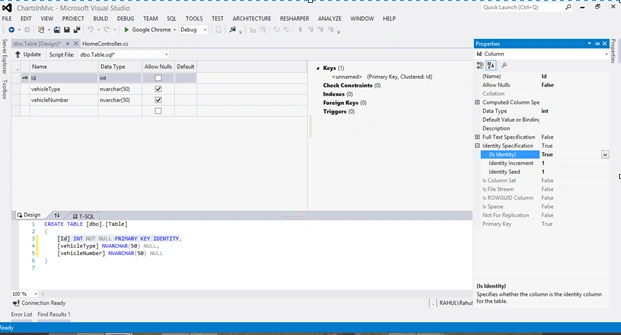
- CREATE TABLE [dbo].[VehicleMaster]
- (
- [Id] INT NOT NULL PRIMARY KEY IDENTITY,
- [vehicleType] NVARCHAR(50) NULL,
- [vehicleNumber] NVARCHAR(50) NULL
- )
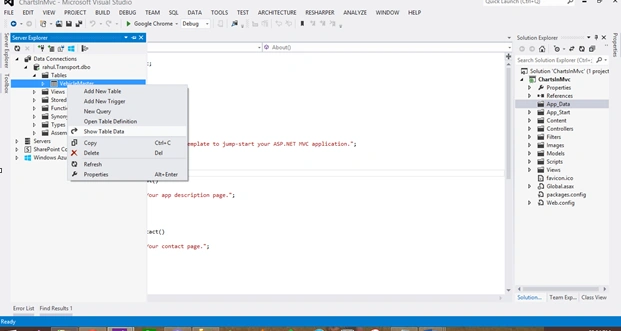
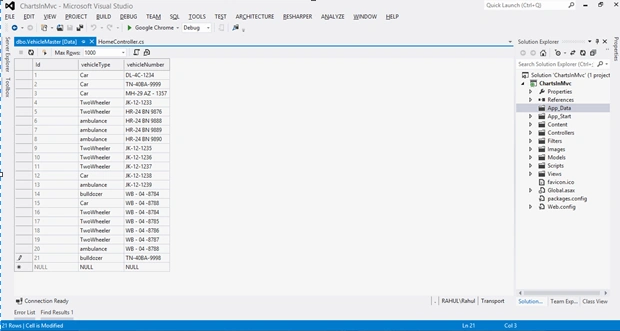
I have manually inserted a few records into the database as in the following:
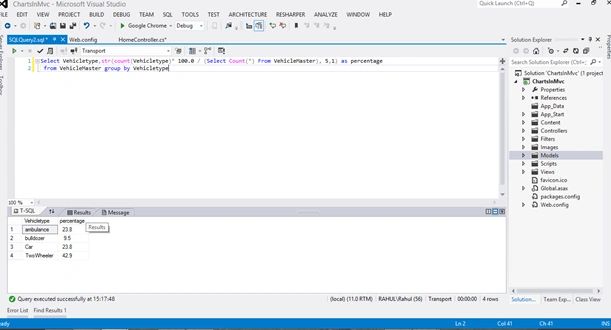
The following query gives us the expected summary with percentages:
Please ignore that since I will be writing all the Data Access and models in the controller class. You can arrange the code to achieve MVC.
The following is the ADO code to get the summary from the database:
- public static DataTable GetVehicleSummary()
- {
- DataTable dt = new DataTable("VehicleSummary");
- string query = "Select Vehicletype,str(count(Vehicletype)* 100.0 / (Select Count(*) From VehicleMaster), 5,1) as percentage ";
- query+="from VehicleMaster group by Vehicletype";
- SqlConnection con = new SqlConnection();
- con.ConnectionString = "Data Source=.;" + "Initial Catalog=Transport;" + "Persist Security Info=True;";
- SqlCommand cmd = new SqlCommand();
- cmd.CommandText = query;
- cmd.Connection = con;
- SqlDataAdapter da = new SqlDataAdapter(cmd);
- con.Open();
- da.Fill(dt);
- con.Close();
- return dt;
- }
Now we will create a model to hold this data and it to the controller:
- public class Summary
- {
- public double Item { get; set; }
- public string Value { get; set; }
- }
After this we will create an Action method with JSON Result as the action result. This method will return the summary to the view to display:
- [HttpGet]
- public JsonResult VehicleSummary()
- {
- List<Summary> lstSummary = new List<Summary>();
- foreach (DataRow dr in GetVehicleSummary().Rows)
- {
- Summary summary = new Summary();
- summary.Value = dr[0].ToString().Trim();
- summary.Item = Convert.ToDouble(dr[1]);
- lstSummary.Add(summary);
- }
- return Json(lstSummary.ToList(), JsonRequestBehavior.AllowGet);
- }
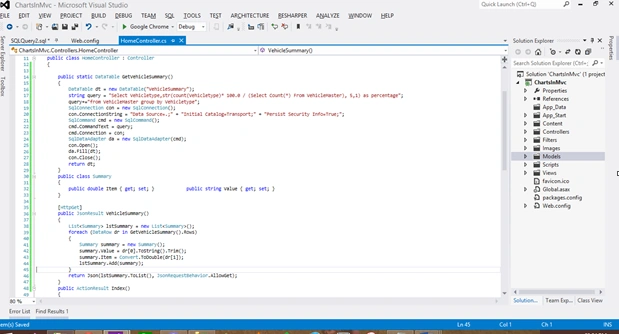
Now to use the HighChart we need to include two libraries. These libraries will do the magic.
- <script src="http://code.highcharts.com/highcharts.js"></script>
- <script src="http://code.highcharts.com/modules/exporting.js"></script>
- <script src="http://ajax.googleapis.com/ajax/libs/jquery/1.11.2/jquery.min.js"></script>
Finally the View. Now go to the view of the Index Action Method and add the following script:
- <script type="text/javascript">
- $(function () {
- $.ajax({
- url: 'Home/VehicleSummary',
- dataType: "json",
- type: "GET",
- contentType: 'application/json; charset=utf-8',
- async: false,
- processData: false,
- cache: false,
- delay: 15,
- success: function (data) {
- // alert(data);
- var series = new Array();
- for (var i in data) {
- var serie = new Array(data[i].Value, data[i].Item);
- series.push(serie);
- }
- DrawPieChart(series);
- },
- error: function (xhr) {
- alert('error');
- }
- });
- });
- function DrawPieChart(series) {
- $('#container').highcharts({
- chart: {
- plotBackgroundColor: null,
- plotBorderWidth: 1, //null,
- plotShadow: false
- },
- title: {
- text: ' Vehicle Summary'
- },
- tooltip: {
- pointFormat: '{series.name}: <b>{point.percentage:.1f}%</b>'
- },
- plotOptions: {
- pie: {
- allowPointSelect: true,
- cursor: 'pointer',
- dataLabels: {
- enabled: false
- },
- showInLegend: true
- }
- },
- series: [{
- type: 'pie',
- name: 'Task Status',
- data: series
- }]
- });
- }
- </script>
Now add a div to show the chart:
- <div id="container" style="min-width: 350px; height: 350px; max-width: 600px; margin: 0 auto"></div>
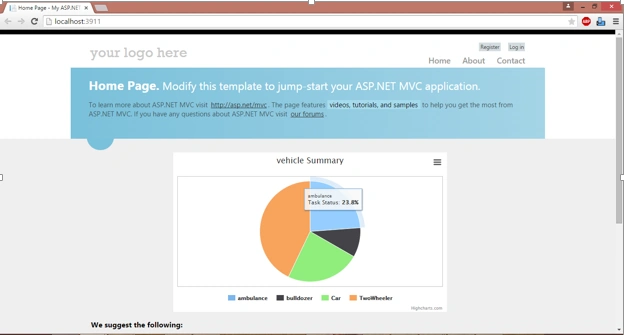
To use various types of charts like line, area column or bar chart, we need to specify the chart type and provide the formatted data to draw the chart.
- $('#container').highcharts({
- chart: {
- type: 'column'
- },
Browse the demo URL and click on view options:
xueling liPosted Jun 13, 2019, 4:26 AM
Thank you! I succeeded. I didn't show it at first because Jquery didn't put it first.
Hiren NayeePosted May 9, 2017, 2:52 AM
Hi how to bind bar chart dynamically can you please tell me i have the json result so can you please tell and please help me.
Vijay BhagatPosted Feb 8, 2017, 6:20 AM
Thanks Rahul,Can you tell me how to drill down this pie chart ??
Mawethu BanziPosted Nov 14, 2016, 2:27 AM
Hi Rahul My name is mawethu Banzi I need some advice I want to create the chart on the mvc framework can you help
BsmPosted Jun 21, 2016, 1:30 AM
I want to create a chart at server side ie from controller and convert it to image. Could you please suggest me any option..
Vignesh ManiPosted Mar 28, 2016, 4:55 PM
Good One
Hariharan RajendranPosted Dec 29, 2015, 10:40 PM
I followed the same steps but chart not displaying in output, am using MVC5.
Rupali ShindePosted Dec 9, 2015, 4:02 AM
nice example
Rahul Kumar SaxenaPosted Apr 28, 2015, 12:02 PM
Good Show..
RahulPosted Apr 27, 2015, 10:46 AM
Thank you Karthik
Karthik Muthu KaruppanPosted Apr 27, 2015, 10:42 AM
Nice one
Sibeesh VenuPosted Apr 27, 2015, 9:03 AM
Good one
Vijay SPosted Apr 27, 2015, 3:20 AM
Very Informative
Saineshwar BageriPosted Apr 27, 2015, 12:35 AM
are they free Rahul sir
Santhakumar MunuswamyPosted Apr 26, 2015, 11:41 PM
Good work