

Introduction
Display numerical data in graph or any modern way to increase the user interface and broad range of radial gauges for displaying distance, speed, duration or any other dynamic data.
Create a new Windows 10 UWP app and name it as you wish.
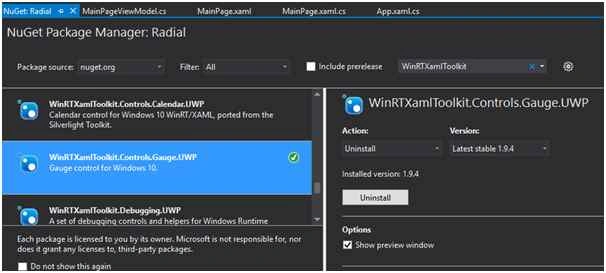
Next right click your project and select Manage NuGet Packages and add the WinRTXamlToolkitControls.Gauge.UWP like the following image.
It’s a free toolkit for Windows UWP App.
 Then add the following XAML code in your XAML page:
Let’s see the steps
- xmlns:controls="using:WinRTXamlToolkit.Controls"
Finally, add the following XAML code inside the Grid to design your Radial Gauge:
- <controls:Gauge x:Name="myGrapg" Value="37" Unit="KM" ScaleTickBrush="Transparent" TickBrush="Transparent" ScaleWidth="30" CanDrag="True">
- <controls:Gauge.NeedleBrush>
- <LinearGradientBrush EndPoint="1,0">
- <GradientStop Color="Black" />
- <GradientStop Color="Blue" Offset=".5" />
- <GradientStop Color="Black" Offset="3" />
- </LinearGradientBrush>
- </controls:Gauge.NeedleBrush>
- <controls:Gauge.TrailBrush>
- <SolidColorBrush Color="Green" Opacity="25" />
- </controls:Gauge.TrailBrush>
- </controls:Gauge>
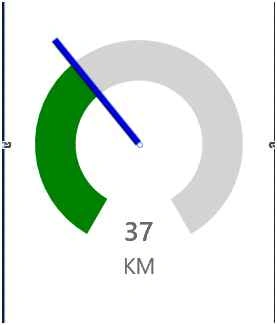
- Value: Value to represent.
- Unit: Unit measure to display.
- TickSpacing: Spacing -in value units.
- NeedleBrush: Colour of the needle.
- TickBrush: Colour of the outer tick.
- ScaleWidth: Thickness of the scale.
- ScaleBrush: Background color of the scale.
- ScaleTickBrush: Colour of the ticks.
- ValueBrush: Colour of the value text.
- UnitBrush: Colour of the unit measure text.
You can set the proprieties value in code behind also.
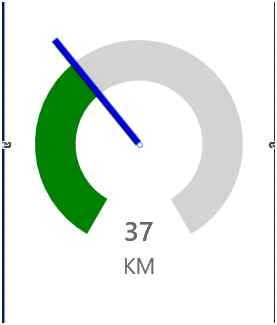
Now run the app and the output looks like the following image.
 Source Code.
Summary
In this article, we learned about Radial Gauge For Windows 10 Universal Windows Platform.
Максим ТимофеевPosted May 6, 2016, 6:37 AM
how to create compass?
Asfend YarPosted Feb 29, 2016, 3:38 AM
thanks
Joe WilsonPosted Dec 29, 2015, 4:17 AM
Thank you very much for sharing.
Suresh MPosted Dec 28, 2015, 11:31 PM
Source code link is also provided at the bottom.
Santhakumar MunuswamyPosted Dec 28, 2015, 11:20 PM
Thanks for sharing. Can you please upload source code?