
Introduction
Ajax (Asynchronous
JavaScript and XML) is a new web development technique used for interactive
websites. AJAX helps us develop web applications and retrieve a small amount of
data from a web server. AJAX consists of different types of technology.
- JavaScript
- XML
- Asynchronous Call to the server
Chart Control
The Chart control include pie, area, range, point, circular, accumulation, data
distribution, Ajax interactive, doughnut. We can statically declare chart data
within the control declaration, or alternatively use data-binding to populate it
dynamically. At runtime the server control generates an image (for example a
.PNG file) that is referenced from the client HTML of the page using a <img/>
element output by the <asp:chart/> control. The server control supports the
ability to cache the chart image, as well as save it on disk for persistent
scenarios. It does not require any other server software to be installed, and
will work with any standard ASP.NET page.
Web Control for creating Chart
- Line Charts
- Smooth Line Charts
- Column Charts
- Area Charts
- Scattered Charts
- Stacked Column Charts
- Pie Charts
- Stacked Area Charts
Step 1 : Open Visual Studio 2010.
- Go to File->New->WebSite
- Select ASP.NET Empty WebSite
Step 2 : Go to Solution Explorer and right-click.
- Select Add->New Item
- Select WebForm
- Default.aspx page open
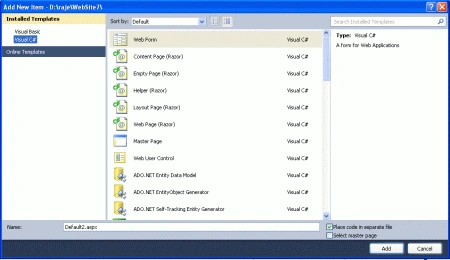
Step 3 : Go to Default.aspx page and click on the [Design] option and drag control from Toolbox.
- Drag Chart control, ScriptManager control, UpdatePanel control
Chart Control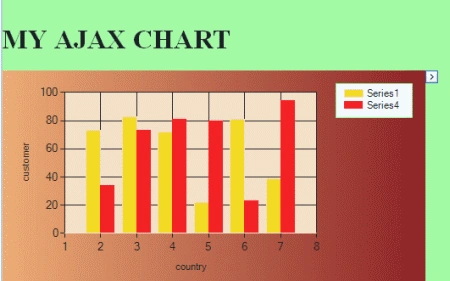
Create Table for Chart Control
Step 4 : Go to Solution Explorer and
right-click.
- Select Add->New Item
- Select SqlDataSource
Step 5 : Go to Server Explorer and right-click.
- Select Table option and right-click
- Select Add New Table and define Field
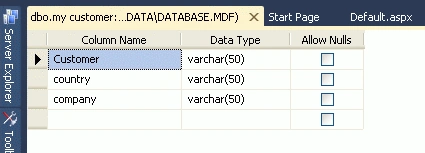
Define Value in the Table
Step 6 : Go to Table option and right-click.
- Select Show Data Table
- Define all Data Field
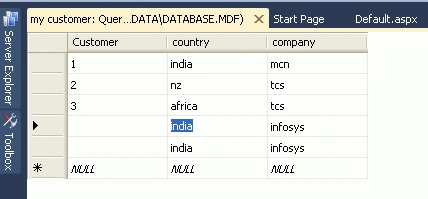
Bind the
Data:
Step 7 :
Now go to the Default.aspx page and click on the Chart control.
- Select New Data Source option
- Define Data Source
- Add SQLDataSource
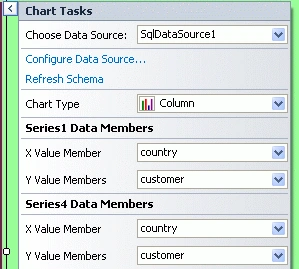
Define Connection String :
Step 8 :
Select SQLDataSource option and click in
ConnectionString.
Select DataBase.mdf file
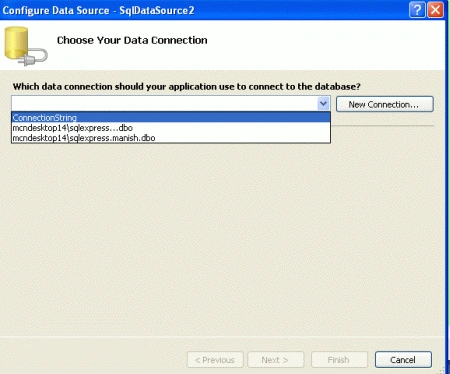
Define
Series and Area
Step 9 :
Now right-click on the Chart control.
Select Series property and click in button
- Define DataSource
- Define XValueMember,
YValueMember
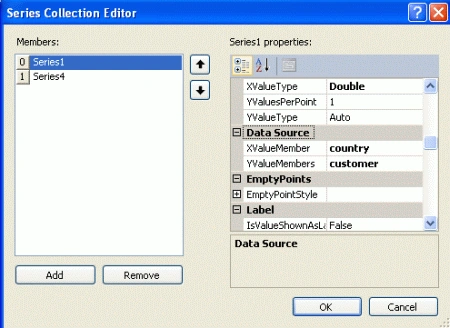
Chart Area
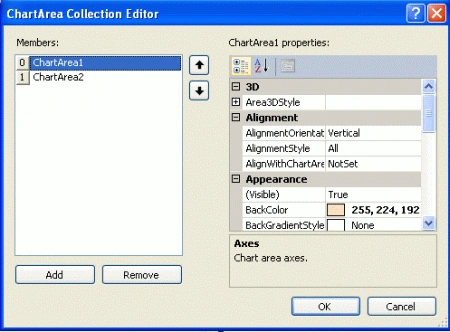
Step 10 :
Now click on the chart control.
- Select Chart Area Option
- Visible True
- Select Style:3D
Step 11 : Now go to Default.aspx
[Source] option and write the below code.
Code :
<head
runat="server">
<title>
my ajax chart</title>
</head>
<body>
<form
id="form1"
runat="server"
style="background-color:
#0099FF">
<asp:ScriptManager
ID="ScriptManager1"
runat="server">
</asp:ScriptManager>
<div
style="background-color:
#99FF99">
<asp:UpdatePanel
ID="UpdatePanel1"
runat="server">
<ContentTemplate>
<br
/>
<h1>
MY AJAX CHART</h1>
<asp:Chart
ID="Chart1"
runat="server"
BackColor="SandyBrown"
BorderlineColor="Red"
DataSourceID="SqlDataSource2"
onload="Chart1_Load"
Palette="Fire"
BackGradientStyle="LeftRight"
BackSecondaryColor="Maroon"
Height="500px"
Width="500px">
<series>
<asp:Series
Legend="Legend1"
Name="Series1"
XValueType="Double"
BorderColor="255, 224,
192" >
</asp:Series>
<asp:Series
ChartArea="ChartArea1"
Legend="Legend1"
Name="Series4">
</asp:Series>
</series>
<MapAreas>
<asp:MapArea
Coordinates="0,0,0,0"
/>
</MapAreas>
<chartareas>|
<asp:ChartArea
BackColor="255, 224,
192" Name="ChartArea1"
BorderWidth="5">
<AxisY
Title="customer">
</AxisY>
<AxisX
LineColor="BlanchedAlmond"
Title="country">
</AxisX>
</asp:ChartArea>
<asp:ChartArea
Name="ChartArea2">
</asp:ChartArea>
</chartareas>
<Legends>
<asp:Legend
BorderColor="128, 255,
128" Name="Legend1">
</asp:Legend>
</Legends>
</asp:Chart>
<asp:SqlDataSource
ID="SqlDataSource2"
runat="server"></asp:SqlDataSource>
<asp:SqlDataSource
ID="SqlDataSource1"
runat="server"
ConnectionString="<%$
ConnectionStrings:ConnectionString %>"
SelectCommand="SELECT
* FROM [my customer]"></asp:SqlDataSource>
<br
/>
</ContentTemplate>
</asp:UpdatePanel>
</div>
</form>
</body>
</html>
Step 12 :
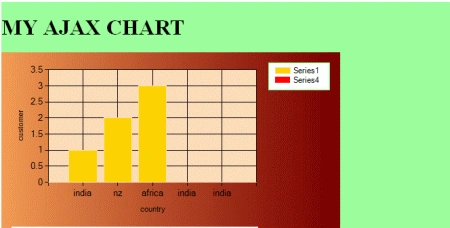
Now run the application by Pressing F5.
KkPosted Jul 29, 2016, 5:53 AM
Can you export this chart to excel
Rajeev KumarPosted Jul 12, 2012, 8:00 AM
how to set different color for different values?