

Today in this article I will show you how to create Google charts in MVC 4 in a simple way.

Using JSON and MVC Razor Syntax
Since we are into development of MVC there are no server controls like RDLC charts where we drag and drop a Report Viewer to an aspx page and in C# just bind the Datasource and it works.
To overcome this kind of thing we have Google charts.
If you have already seen my Google Charts With ASP.NET Webforms than you will find them easy else you can have a look at this link:
URL: How to Create Google Charts in ASP.Net With JSON.
Since most Corporate people won't like to see data in a numbers form (Jan = 150000, FEB = 180000) we cannot visualize what is happning with numbers to overcome this so we use Charts.
Which is simple to see and understand and think about.
Example
Consider a bank having crores of transcations yearly. If he want to see 10 years of data and if you display them as numbers then he will find it difficult to understand that data.
If we have a WebMethod in ASP.NET Webforms then in MVC we have JsonResult.
Advantages
The following are the advantages:
- Its free to use from Google.
- Easy to customize and design.
- Simple to implement.
The following is the procedure:
- SQL Data part and Query designing.
- Model Design.
- Controller part.
- View part.
Let's Begin.
the requirements for Developing Google Charts in ASP.NET MVC are ASP.NET MVC, SQL Server and a reference for the Google jsapi.
SQL Data part and Query designing
In this step I will show which table I am using and which type of query I am binding to the Google Charts.
Here I have used the following 2 tables:
- PaymentDetails
- PlanMaster
In the PaymentDetails table I am storing all the payment related data with PlanID from the PlanMasterTable. In the PlanMaster table I am storing all Plannames.
Here I am providing a Table Snapshot view. I will provide all the tables script and data for testing.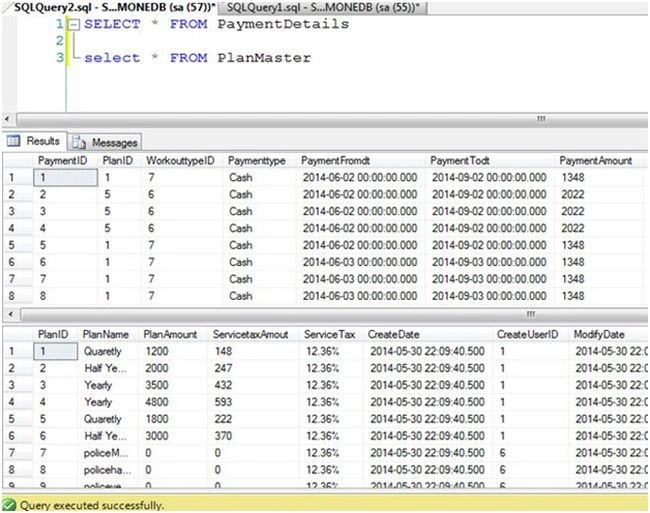
Here is the query that will get the records and we will bind them to the charts.
It's a normal query I have used. In a real scenario it would have many more tables.
I have created a Stored Procedure for displaying the data.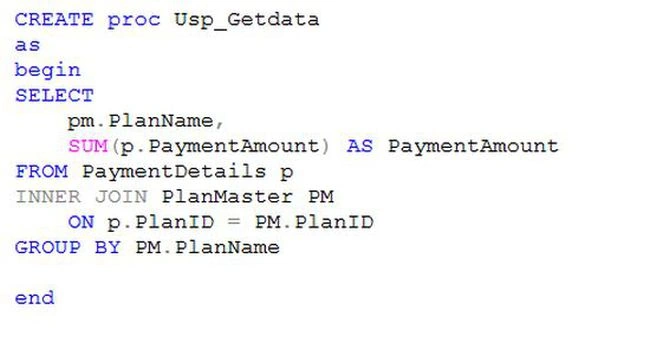
Hey we have now completed the SQL Server part. Now we are moving to C# and ASP.NET.
This procedure is similar to my other Google charts articles because it will be easy for the developer of Webforms to use if he migrates to MVC.
How To Create Project
- Create a New Project
- From the Visual C# Templates select the Web option
- After selecting Web option select ASP.NET MVC 4 Web Application.
- Enter the name of the solution as “GoogleCharts_with_MVC4”.
Model Design
- After creating the MVC application we will design the Model.
- In the Model Design part I know what output I will get from the query.
- Depending on that I have created a Class of that type.
From the above SQL Stored Procedure I will get the 2 fields as Output PlanName and PaymentAmount.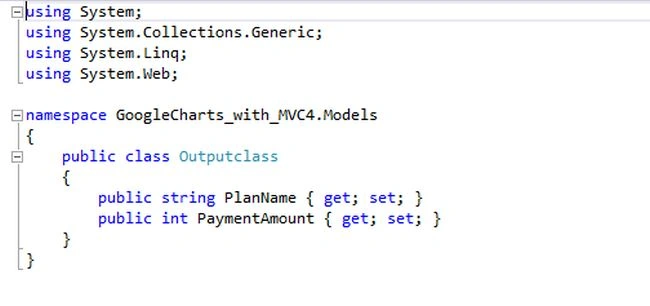
Adding Folder And Class inside that folder
I will add a folder with the name ”Repo“ and Inside that folder I will add a “Class“ with name.
mydataservice.cs
In this class I will get data from the database and return a list of types Outputclass.
Code for the mydataservice Class
In this class I called the method Listdata();
- using GoogleCharts_with_MVC4.Models;
- using System.Data;
- using System.Configuration;
- using System.Data.SqlClient;
- namespace GoogleCharts_with_MVC4.Repo
- {
- public class mydataservice
- {
- public IEnumerable Listdata()
- {
- using (SqlConnection con = new SqlConnection
- (ConfigurationManager.ConnectionStrings["MYCON"].ToString()))
- {
- string Query = @"SELECT
- pm.PlanName,
- SUM(p.PaymentAmount) AS PaymentAmount
- FROM PaymentDetails p
- INNER JOIN PlanMaster PM ON p.PlanID = PM.PlanID
- GROUP BY PM.PlanName";
- // this is query which in in stored procedure
- var list = con.Query<Outputclass>("Usp_Getdata").AsEnumerable();
- // List of type Outputclass which it will return .
- return list;
- }
- }
- }
- }

Inside that there is a simple SQL Connection.

Then there is string containing a SQL Query that is for refernce only because the Stored Procedure contains that query only.

After Completing the String part
Here I am using the Dapper ORM for retriving data from the database. You can have other ORM or another data retreival technique.
But it should return only a list .
Here I am passing a Stored Procedure with the name “Usp_Getdata” .

And finally I will return this List.

That completes the Model Design.
Controller Part
Add a new Controller with the name “DisplaychartsController”.
After adding the Controller you will see a default method with the name “Index”. This is our Main action result that will be called when we call this View().
In the next step I created JsonResult of the name Piechart .
Inside that JsonResult I have called the method with the name “Listdata();” that will return a List of type “Outputclass”.

Then just return the JSON.
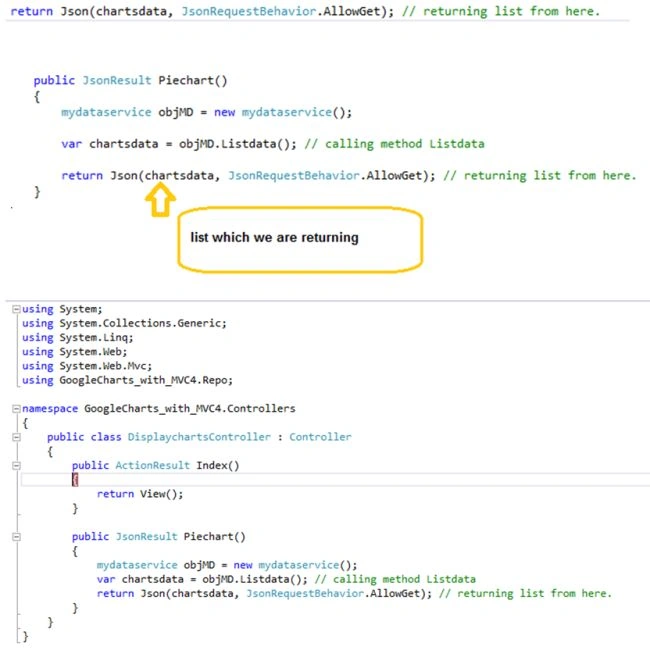
Finally the Controller and View would look like this.
We have completed the Controller part now to proceed to the View part.
View Part
The View Part we will perform how to add Add the View.
In the View Part right-click inside the Controller and select Add View.
Then a new wizard will pop up.
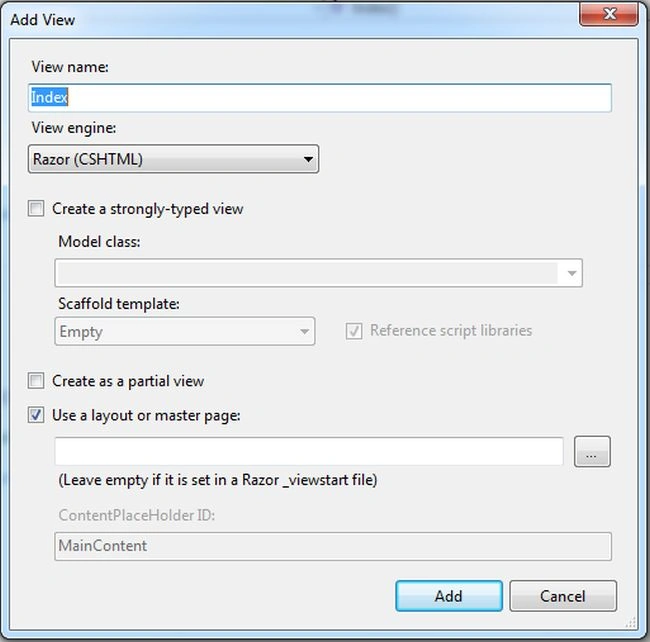
- We need to create an empty view, that is why we are not selecting a model.
- The view name would be “Index” as shown in the above Snapshot.
- After adding “Index View” you will see a blank page with the name “Index”.
Let's start with the final step, designing the Google Charts.
In this step we will work on the View with the name “Index”.
After adding the view Index it will only contain this viewbag part in it.
- @{
- ViewBag.Title = "Google charts with MVC 4";
- }
- <script type="text/javascript" src="//ajax.googleapis.com/ajax/libs/jquery/1.9.1/jquery.min.js"></script>
- <script type="text/javascript" src="https://www.google.com/jsapi"></script>
- <script type="text/javascript">
- google.load("visualization", "1", { packages: ["corechart"] });
- </script>
- <script type="text/javascript">
- $(function () {
- $.ajax({
- type: 'POST',
- dataType: 'json',
- contentType: 'application/json',
- url: '@Url.Action("Piechart")',
- data: '{}',
- success: function (chartsdata) {
- // Callback that creates and populates a data table,
- // instantiates the pie chart, passes in the data and
- // draws it.
- var data = new google.visualization.DataTable();
- data.addColumn('string', 'PlanName');
- data.addColumn('number', 'PaymentAmount');
- for (var i = 0; i < chartsdata.length; i++) {
- data.addRow([chartsdata[i].PlanName, chartsdata[i].PaymentAmount]);
- }
- // Instantiate and draw our chart, passing in some options
- var chart = new google.visualization.PieChart(document.getElementById('chartdiv'));
- chart.draw(data,
- {
- title: "Show Google Chart in ASP.NET",
- position: "top",
- fontsize: "14px",
- chartArea: { width: '50%' },
- });
- },
- error: function () {
- alert("Error loading data! Please try again.");
- }
- });
- })
- </script>
- var data = new google.visualization.DataTable();
- data.addColumn('string', 'PlanName');
- data.addColumn('number', 'PaymentAmount');
- for (var i = 0; i < chartsdata.length; i++)
- {
- data.addRow([chartsdata[i].PlanName, chartsdata[i].PaymentAmount]);
- }
- var chart = new google.visualization.PieChart(document.getElementById('chartdiv'));
- chart.draw(data,
- {
- title: "Show Google Chart in ASP.NET",
- position: "top",
- fontsize: "14px",
- chartArea: { width: '50%' },
- });
- <script type="text/javascript">
- $(function () {
- $.ajax({
- type: 'POST',
- dataType: 'json',
- contentType: 'application/json',
- url: '@Url.Action("Piechart")',
- data: '{}',
- success: function (chartsdata) {
- // Callback that creates and populates a data table,
- // instantiates the pie chart, passes in the data and
- // draws it.
- var data = new google.visualization.DataTable();
- data.addColumn('string', 'PlanName');
- data.addColumn('number', 'PaymentAmount');
- for (var i = 0; i < chartsdata.length; i++)
- {
- data.addRow([chartsdata[i].PlanName, chartsdata[i].PaymentAmount]);
- }
- // Instantiate and draw our chart, passing in some options
- var chart = new google.visualization.PieChart(document.getElementById('chartdiv'));
- chart.draw(data,
- {
- title: "Show Google Chart in Asp.net",
- position: "top",
- fontsize: "14px",
- chartArea: { width: '50%' },
- });
- },
- error: function () {
- alert("Error loading data! Please try again.");
- }
- });
- })
- </script>
The last thing is to display the chart. I used a div for this and given an id to it.
- <div id="chartdiv" style="width: 600px; height: 350px;">
- </div>
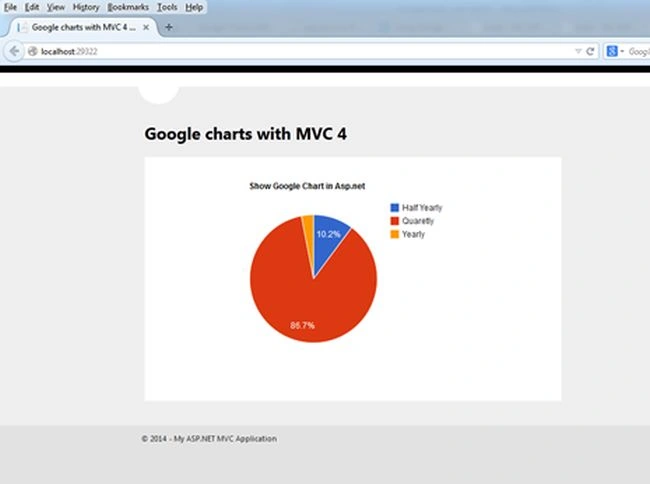
Now just run the application and check it.
Here comes the final output Google Charts with MVC 4. I am Loving it.
If you need to work on other charts such as:
- Columns charts
- Area Charts
- Bar Charts
- Scatter charts
- Combo charts
You need to just make the relevant changes in this part of code.
If you are developing Combo charts then you need to make changes in the Query and also DataTable of Google.
Need to add more columns.
As needed, make the change in the for Loop while adding the DataRow.
- var data = new google.visualization.DataTable();
- data.addColumn('string', 'PlanName');
- data.addColumn('number', 'PaymentAmount');
- for (var i = 0; i < chartsdata.length; i++) {
- data.addRow([chartsdata[i].PlanName, chartsdata[i].PaymentAmount]);
- }
- // Instantiate and draw our chart, passing in some options
- var chart = new google.visualization.PieChart(document.getElementById('chartdiv'));
URL: Google Charts
You can download this charts attachment and check it. You will find all the examples and related code in details.
Maximiliano BlascoPosted Nov 18, 2017, 5:01 PM
Excelente! Muchas gracias por compartir.
Aditya AgarwalPosted Jun 13, 2017, 3:41 AM
Aditya Agarwal'SqlConnection' does not contain a definition for 'Query' and no extension method 'Query' accepting a first argument of type 'SqlConnection' could be found (are you missing a using directive or an assembly reference?) *This is the error which is showing up in Mydataservice.cs file!
Aditya AgarwalPosted Jun 13, 2017, 3:40 AM
'SqlConnection' does not contain a definition for 'Query' and no extension method 'Query' accepting a first argument of type 'SqlConnection' could be found (are you missing a using directive or an assembly reference?)
Ronise RochaPosted Jan 14, 2016, 9:03 AM
hello, I enjoyed the page, but I need a lot of help.I'm trying to make a chart using google chart but starting with a few user-input arguments, such as: PaymentFromdt and PaymentAmount. I did that a form using ajax and want the search to return me a list as a result and also a graphic with the sums of these results. Now I can return the list but I can not get the graph. Can you help me?
Srivatsan RajagopalanPosted Nov 19, 2015, 10:37 AM
I am not able to see the chart at all please help
Vincent TohPosted Aug 15, 2015, 4:08 AM
Hi, I've completed the tutorial with no errors. However, when I hit ctrl+f5 the browser shows "Error Loading Data, Please Try Again!"
John AvPosted Aug 13, 2015, 10:18 AM
I have error with con.Query in mydataservice... Error description: Error 1 'System.Data.SqlClient.SqlConnection' no contiene una definici?n de 'Query' ni se encontr? ning?n m?todo de extensi?n 'Query' que acepte un primer argumento de tipo 'System.Data.SqlClient.SqlConnection' (?falta una directiva using o una referencia de ensamblado?) C:\Users\Joe xD\Documents\Visual Studio 2013\Projects\Proyecto\Proyecto\Repo\mydataservice.cs 31 32 Proyecto......... Thanks
Chanel ChooPosted Jun 4, 2015, 5:07 AM
Thanks!
Saineshwar BageriPosted Jun 4, 2015, 4:02 AM
<script type="text/javascript" src="//ajax.googleapis.com/ajax/libs/jquery/1.9.1/jquery.min.js"></script> <script type="text/javascript" src="https://www.google.com/jsapi"></script> <script type="text/javascript"> google.load("visualization", "1", { packages: ["corechart"] }); </script>
Saineshwar BageriPosted Jun 4, 2015, 4:00 AM
Please read complete article i have showed in this .
Saineshwar BageriPosted Jun 4, 2015, 12:56 AM
do not require any assembly chanel choo sir it only take refer reference link of google libary
Chanel ChooPosted Jun 4, 2015, 12:08 AM
I have error by using GoogleCharts_with_MVC4.Models. how to get the missing assembly?
Akhil GargPosted Apr 9, 2015, 3:04 PM
nice article...
Saineshwar BageriPosted Feb 17, 2015, 8:21 AM
Jaimin maheta sir replace this line var chart = new google.visualization.BarChart(document.getElementById('chartdiv')); it will create bar chart for your .
Former memberPosted Feb 17, 2015, 7:03 AM
how to bind barchart
anup kumarPosted Jan 19, 2015, 12:13 PM
good article. it help me
Guest UserPosted Dec 8, 2014, 2:29 AM
good one. i'll use sometime now. i've been using NVD3, D3 or highchart so far
Jitendra ParidaPosted Oct 16, 2014, 9:04 AM
Nice useful article..
Shiju JosephPosted Oct 14, 2014, 9:19 AM
Good Work !
Pradeep ShetPosted Oct 14, 2014, 8:37 AM
nice..
Nimit JoshiPosted Oct 12, 2014, 11:02 PM
Very Informative
Dinesh BeniwalPosted Oct 12, 2014, 11:01 PM
Good work.
Mahesh ChandPosted Oct 12, 2014, 10:56 PM
Great article Saineshwar. Thank you for great work.I wonder if you have found a way to reduce spacing of the chart? We are using same charts on C# Corner author profiles but placing legends is always a challenge.
Vithal WadjePosted Oct 12, 2014, 1:37 PM
good work keep it up