

Introduction
In this article, we are going to understand the creation of graphical equation representations using the HTML 5 canvas. In this section of this article, we will perform a graphical equation by setting up the co-ordinate geometry within the canvas tag and its properties.
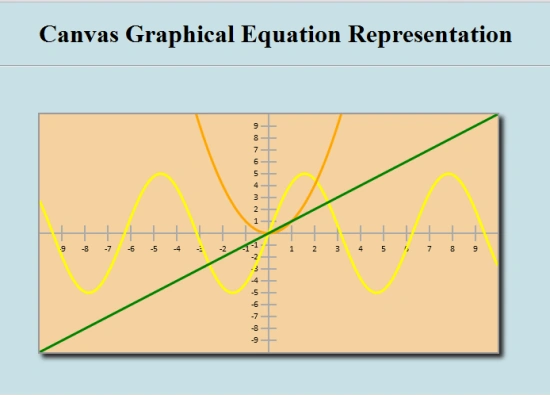
A Graphical equation displays when the application runs in the browser.
Here we will use some JavaScript and some styles along with HTML code. Just go through the steps to see how to create this application.
Let's see how the CanvasGraphEquation application can be created. To do so use the following steps.
Step 1 : Open a HTML editor or Visual Studio.
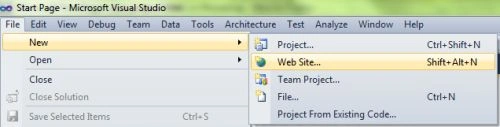
Open File menu ->select new ->Choose Website
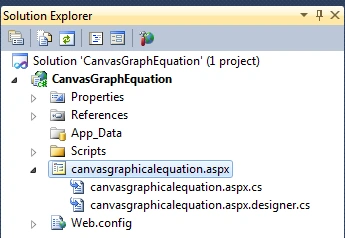
- Go to Solution Explorer
- Right-click on the Application name
- Select Add-->add new item
- Now in the window that opens, select an HTML page or new Webform
- Rename it to canvasgraphicalequation.aspx
CSS Script
- <style>
- body
- {
- margin: 0px;
- padding: 0px;
- }
- Canvas
- {
- border: 2px solid #9C9898;
- margin-top: 50px;
- margin-left: 50px;
- background-color: #F4D19F;
- box-shadow: 5px 5px 8px #222;
- }
- .title
- {
- text-align: center;
- font-family: Segoe UI Light, Arial, Helvetica;
- font-size: 2.2em;
- margin: 1em;
- }
- .info
- {
- text-align: center;
- font-family: Segoe UI Light, Arial, Helvetica;
- font-size: 1.2em;
- margin: 0.25em;
- }
- </style>
The whole JavaScript looks as in the following:
Step 4: In this section we are going to become familiar with the body part of HTML scripting. Replace this script from the body section of the canvasgraphicalequation.aspx page. Here we pass a Canvas in the canvas tag.
Step 5: The complete code for the CanvasGraphEquation application.
Step 6: Output Press F5
- <script>
- function Graph(config)
- {
- // user defined properties
- this.canvas = document.getElementById(config.canvasId);
- this.minX = config.minX;
- this.minY = config.minY;
- this.maxX = config.maxX;
- this.maxY = config.maxY;
- this.unitsPerTick = config.unitsPerTick;
- // constants
- this.axisColor = "#aaa";
- this.font = "8pt Calibri";
- this.tickSize = 20;
- // relationships
- this.context = this.canvas.getContext("2d");
- this.rangeX = this.maxX - this.minX;
- this.rangeY = this.maxY - this.minY;
- this.unitX = this.canvas.width / this.rangeX;
- this.unitY = this.canvas.height / this.rangeY;
- this.centerY = Math.round(Math.abs(this.minY / this.rangeY) * this.canvas.height);
- this.centerX = Math.round(Math.abs(this.minX / this.rangeX) * this.canvas.width);
- this.iteration = (this.maxX - this.minX) / 1000;
- this.scaleX = this.canvas.width / this.rangeX;
- this.scaleY = this.canvas.height / this.rangeY;
- // draw x and y axis
- this.drawXAxis();
- this.drawYAxis();
- }
- Graph.prototype.drawXAxis = function ()
- {
- var context = this.context;
- context.save();
- context.beginPath();
- context.moveTo(0, this.centerY);
- context.lineTo(this.canvas.width, this.centerY);
- context.strokeStyle = this.axisColor;
- context.lineWidth = 2;
- context.stroke();
- // draw tick marks
- var xPosIncrement = this.unitsPerTick * this.unitX;
- var xPos, unit;
- context.font = this.font;
- context.textAlign = "center";
- context.textBaseline = "top";
- // draw left tick marks
- xPos = this.centerX - xPosIncrement;
- unit = -1 * this.unitsPerTick;
- while (xPos > 0)
- {
- context.moveTo(xPos, this.centerY - this.tickSize / 2);
- context.lineTo(xPos, this.centerY + this.tickSize / 2);
- context.stroke();
- context.fillText(unit, xPos, this.centerY + this.tickSize / 2 + 3);
- unit -= this.unitsPerTick;
- xPos = Math.round(xPos - xPosIncrement);
- }
- // draw right tick marks
- xPos = this.centerX + xPosIncrement;
- unit = this.unitsPerTick;
- while (xPos < this.canvas.width)
- {
- context.moveTo(xPos, this.centerY - this.tickSize / 2);
- context.lineTo(xPos, this.centerY + this.tickSize / 2);
- context.stroke();
- context.fillText(unit, xPos, this.centerY + this.tickSize / 2 + 3);
- unit += this.unitsPerTick;
- xPos = Math.round(xPos + xPosIncrement);
- }
- context.restore();
- };
- window.onload = function ()
- {
- var myGraph = new Graph({
- canvasId: "myCanvas",
- minX: -10,
- minY: -10,
- maxX: 10,
- maxY: 10,
- unitsPerTick: 1
- });
- myGraph.drawEquation(function (x)
- {
- return 5 * Math.sin(x);
- }, "yellow", 3);
- myGraph.drawEquation(function (x)
- {
- return x * x;
- }, "orange", 3);
- myGraph.drawEquation(function (x)
- {
- return 1 * x;
- }, "green", 3);
- };
- </script>
- <body style="background-color: #C9E0E6">
- <center>
- <h1>
- Canvas Graphical Equation Representation
- </h1>
- </center>
- <hr />
- <canvas id="myCanvas" width="578" height="300">
- </canvas>
- </body>
- <%@ Page Language="C#" AutoEventWireup="true" CodeBehind="canvasgraphicalequation.aspx.cs" Inherits="CanvasGraphEquation._Default" %>
- <!DOCTYPE html PUBLIC "-//W3C//DTD XHTML 1.0 Transitional//EN" "http://www.w3.org/TR/xhtml1/DTD/xhtml1-transitional.dtd">
- <html xmlns="http://www.w3.org/1999/xhtml">
- <head runat="server">
- <style>
- </style>
- <script>
- </script>
- </head>
- <body style="background-color: #C9E0E6">
- <center>
- <h1>
- Canvas Graphical Equation Representation
- </h1>
- </center>
- <hr />
- <canvas id="myCanvas" width="578" height="300">
- </canvas>
- </body>
- </html>
Note: For the accurate output of HTML5 applications, you must have the Google Chrome browser on your PC. A Graphical equation displays when the application runs on the browser.
Join the conversation! Your thoughts help the community grow.