

In this article we will see how we can draw a pie chart of our given value.
I provided a description as a comment for each line of code below which will help you to draw a pie chart.
Main Code :
using System;
using System.Collections.Generic;
using System.ComponentModel;
using System.Data;
using System.Drawing;
using System.Linq;
using System.Text;
using System.Windows.Forms;
using Microsoft.VisualBasic;
using System.Collections;
using System.Collections.Generic;
using System.Diagnostics;
namespace WindowsFormsApplication1
{
public partial class Form2 : Form
{
Form frm1=new Form1();
public Form2()
{
InitializeComponent();
}
private void button1_Click(object sender, EventArgs e)
{
//Call Main Function Which Will Help To Draw a Pie Chart…
DrawPieChartOnForm();
}
public void DrawPieChartOnForm()
{
//Take Total Five Values & Draw Chart Of These Values.
int[] myPiePercent = { 10, 20, 25, 5, 40 };
//Take Colors To Display Pie In That Colors Of Taken Five Values.
Color[] myPieColors = {Color.Red,Color.Black,Color.Blue,Color.Green,Color.Maroon};
using (Graphics myPieGraphic = this.CreateGraphics())
{
//Give Location Which Will Display Chart At That Location.
Point myPieLocation = new Point(10, 10);
//Set Here Size Of The Chart…
Size myPieSize = new Size(150, 150);
//Call Function Which Will Draw Pie of Values.
DrawPieChart(myPiePercent, myPieColors, myPieGraphic, myPieLocation, myPieSize);
}
}
// Draws a pie chart.
public void DrawPieChart(int[] myPiePerecents, Color[] myPieColors, Graphics myPieGraphic, Point
myPieLocation, Size myPieSize)
{
//Check if sections add up to 100.
int sum = 0;
foreach (int percent_loopVariable in myPiePerecents)
{
sum += percent_loopVariable;
}
if (sum != 100)
{
MessageBox.Show("Sum Do Not Add Up To 100.");
}
//Check Here Number Of Values & Colors Are Same Or Not.They Must Be Same.
if (myPiePerecents.Length != myPieColors.Length)
{
MessageBox.Show("There Must Be The Same Number Of Percents And Colors.");
}
int PiePercentTotal = 0;
for (int PiePercents = 0; PiePercents<myPiePerecents.Length; PiePercents++)
{
using (SolidBrush brush = new SolidBrush(myPieColors[PiePercents]))
{
//Here it Will Convert Each Value Into 360, So Total Into 360 & Then It Will Draw A Full Pie Chart.
myPieGraphic.FillPie(brush, new Rectangle(new Point(10,10), myPieSize), Convert.ToSingle(PiePercentTotal * 360 / 100), Convert.ToSingle(myPiePerecents[PiePercents] * 360 / 100));
}
PiePercentTotal += myPiePerecents[PiePercents];
}
return;
}
}
}
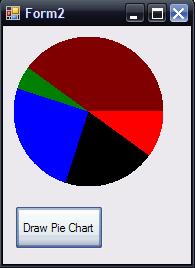
See below Image For Output :
Priyadarshini BPosted Aug 15, 2012, 7:21 AM
Great post! Very simple and easy to understand. You can also go for Microsoft Chart Control that enables you to create all kind of charts instantly in a few steps. Check this out. http://programmingfree.blogspot.in/2012/08/create-3d-charts-and-graphs-in-net.html
Olamide AfolabiPosted Apr 29, 2011, 6:52 AM
i'm everly grateful for what you guys are doing. I'm working hard to be good so that i can also drop solutions. This was a job well done. Love u all!