

Technology used : Visual Studio 2012 and SQL Server 2008
Step 1: Create a database named "Test" in SQL Server 2008 that holds a Table called "Employee" with 4 columns (ID, Name, Salary and Dept) , where the ID column is an Identity field and a Primary Key as in the following:
CREATE TABLE [dbo].[Employee](
[ID] [int] IDENTITY(1,1) NOT NULL,
[Name] [varchar](50) NULL,
[Salary] [int] NULL,
[Dept] [varchar](50) NULL,
CONSTRAINT [PK_Employee] PRIMARY KEY CLUSTERED
(
[ID] ASC
)WITH (PAD_INDEX = OFF, STATISTICS_NORECOMPUTE = OFF, IGNORE_DUP_KEY = OFF,ALLOW_ROW_LOCKS = ON, ALLOW_PAGE_LOCKS = ON)
ON [PRIMARY]
) ON [PRIMARY]
Then insert some data into the table as in the following:
insert into Employee(Name,Salary,Dept)values('B',10000,
'Finance')
insert into Employee (Name,Salary,Dept)values('C',60000,'IT')
insert into Employee (Name,Salary,Dept)values('D',20000,
'Finance')
insert into Employee (Name,Salary,Dept)values('E',10000,'IT')
insert into Employee (Name,Salary,Dept)values('G',40000,
'Finance')
select * from employee

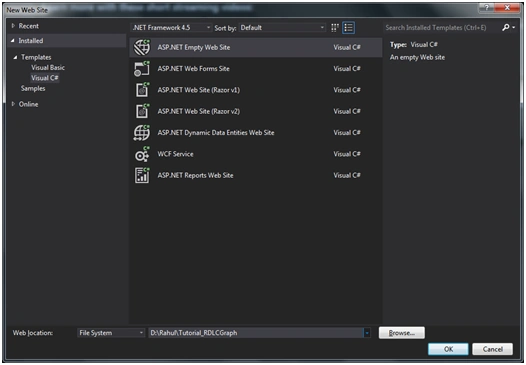
Step 2: Create a new empty website named "Tutorial_RDLCGraph".
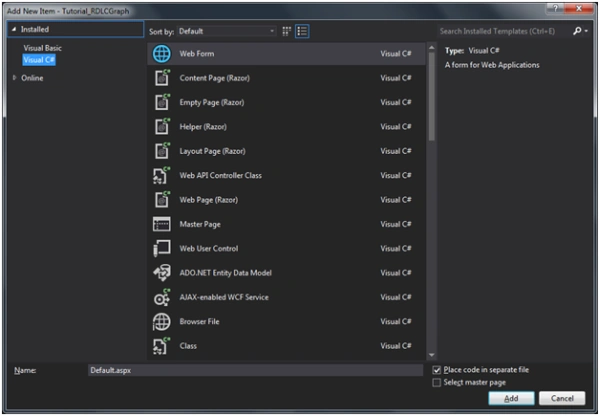
Step 3: Create a new Page named "Default.aspx" by right-clicking on the project in Solution Explorer and click on "Add" -> "New Item".
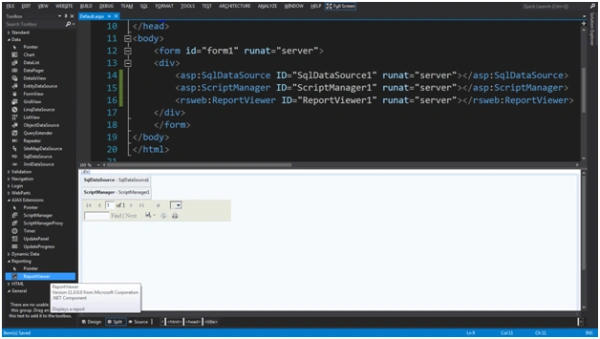
Step 4: Add a "ScriptManager" from the Ajax Extensions section, "SQLDataSource" from the Data section and "ReportViewer Control" from the Reporting section onto the page.
Step 5: Right-click on the Selected SQL DataSource control in Design Mode then use the following procedure:
- Click on "Configure Data Source", it shows a Data Source window.
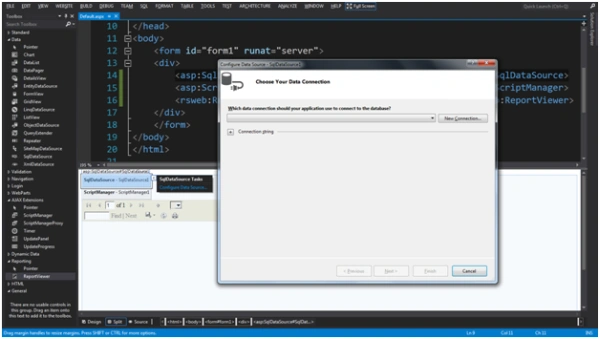
- Click on the "New Connection" button of the window, it shows the New Connection window for providing the details, like:
- Select the "Microsoft SQL Server (SqlClient)" as the Data Source.
- Your database instance name as SeverName.
- Use SQL Server Authentication Mode as "Long on to the server".
- Type the Usrename as "sa" and the password of your database.
- Select the database name as "Test".
Then click the "OK" button.
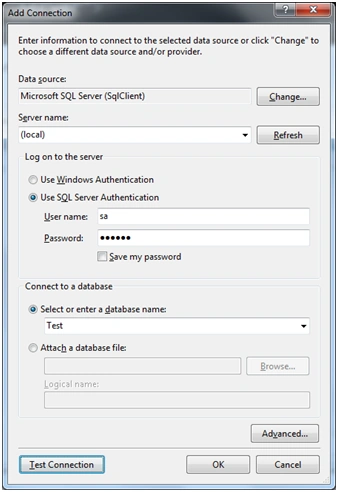
- Now click on the "Next" Button.
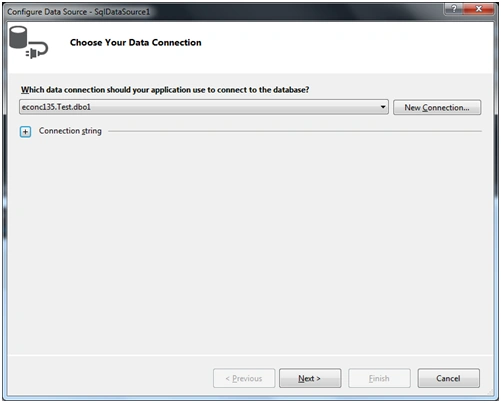
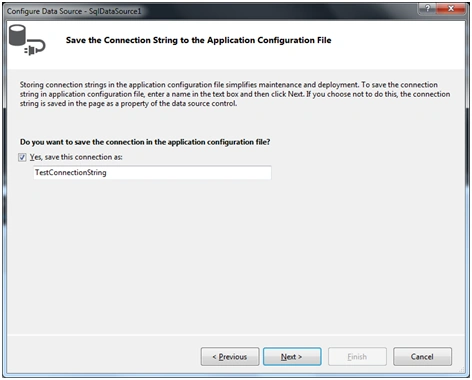
- Check the CheckBox and click on the "Next" button.
- Click on the "Next" button after choosing the table and columns that you want to display in your report.
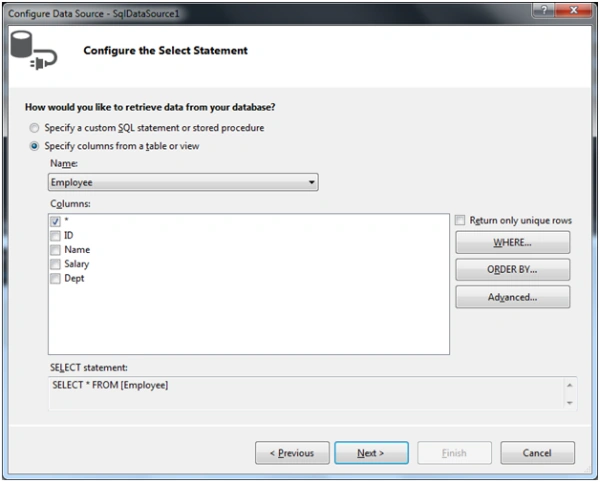
- Click on the "Finish" button.
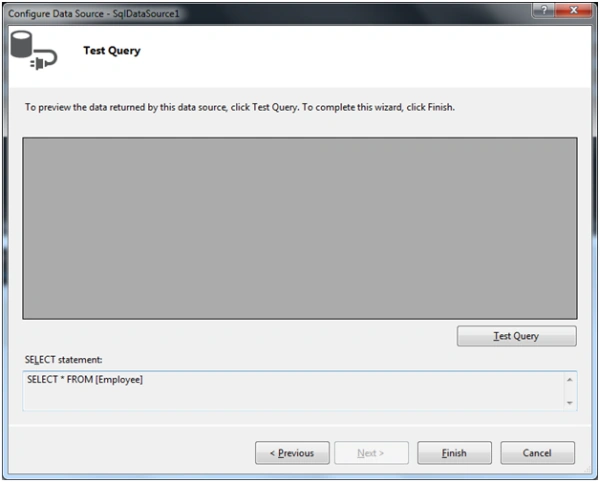
Step 6: Add a RDLC File named "Report_Graph" file by right-clicking on the project in Solution Explorer and click on "Add" -> "New Item".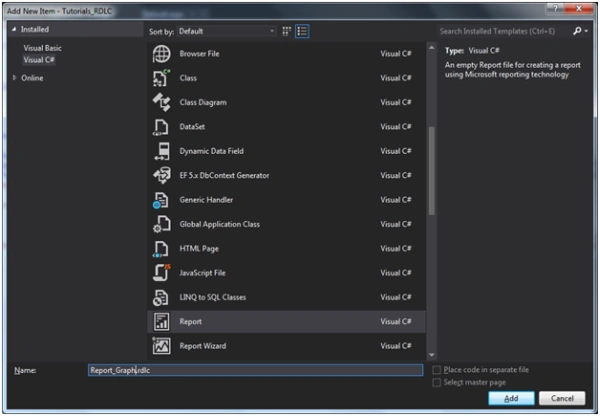
Step 7: To create the Chart and bind it with the DataSet use the following sub-procedure: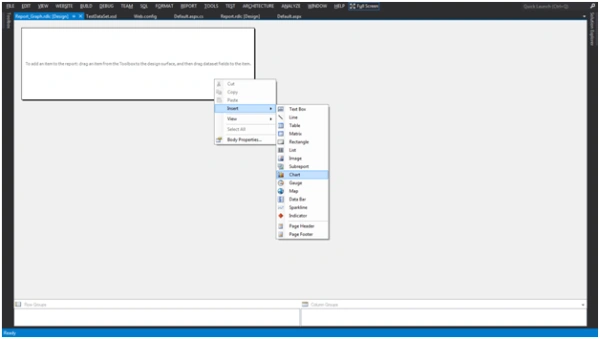
- Right-click on the report and insert the chart that populates a Chart Type window where you can select the type of chart and click "OK".
Note: In this example I am using 3-D Exploded Pie Chart.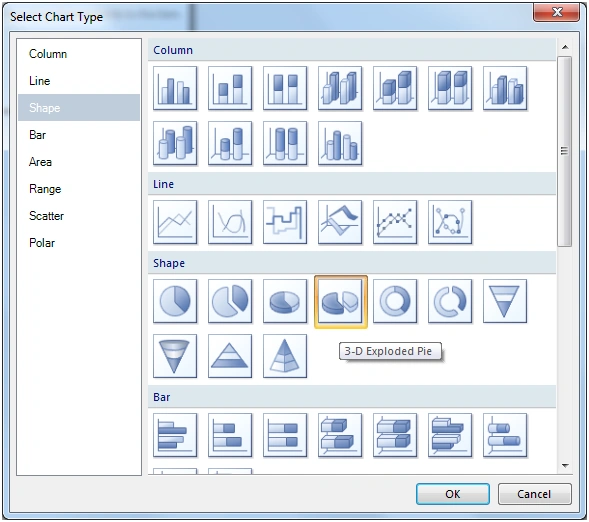
- When you click on the "OK" button, you will see a Data Source window. Select the connection string name in the new window that you have created earlier in SQL DataSource. On the Default Page click on the "Next" button.
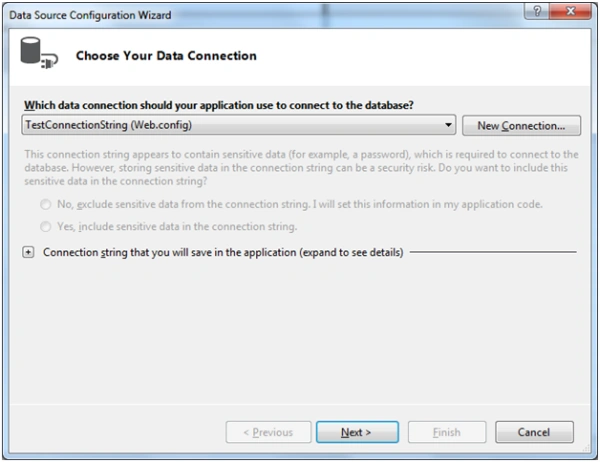
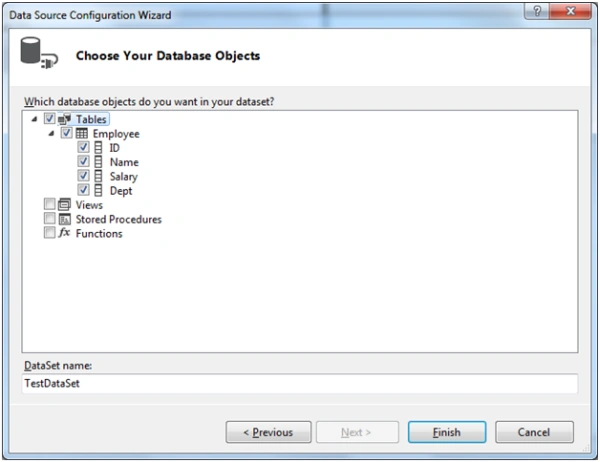
- Click on the "Next" button and expand the "Tables" treeview and the check on your table named "Employee"and click on the "Finish" Button.
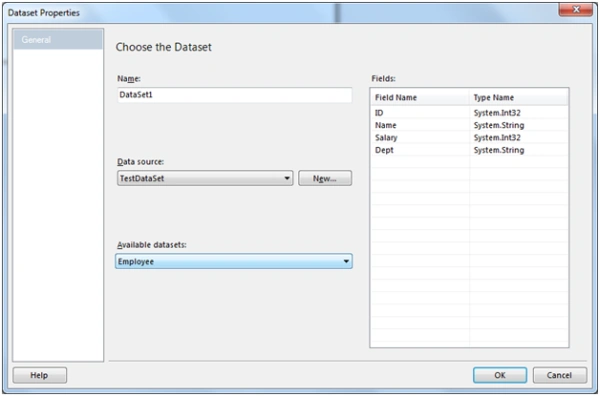
- Click on "Finish" and you will see the Dataset window; click on the "OK" button.
- Now you will see the Chart on your report, expand the body of the report and Chart size after selection.
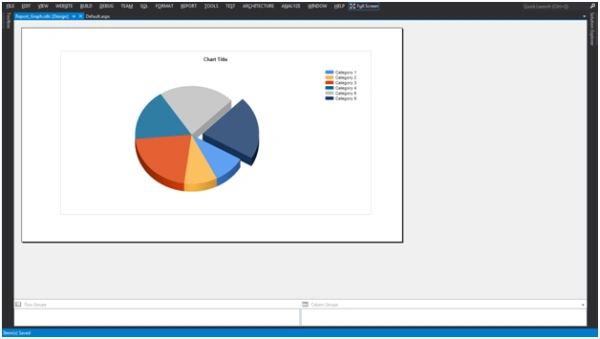
- Select the Legend and you will see the Chart Data window. Add the Department in the Category Groups and ∑ Values then right-click on the Legend and check the "Show Legend Title" and change it.

- Check the Show Data Lables after right-clicking on the Pie Chart and change the Chart Title.
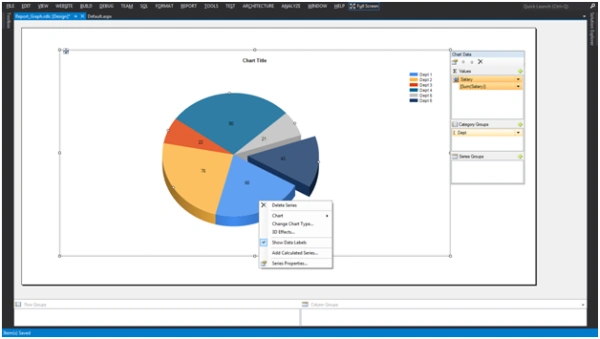
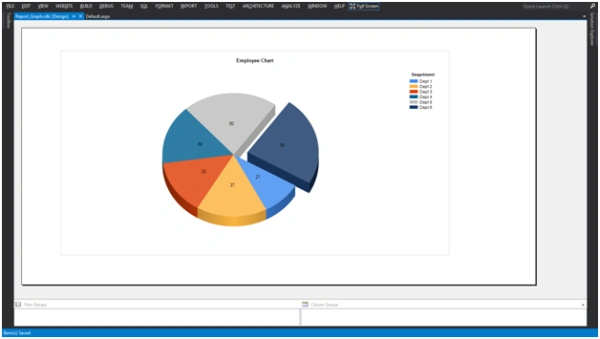
Finally your chart is ready and will look like this: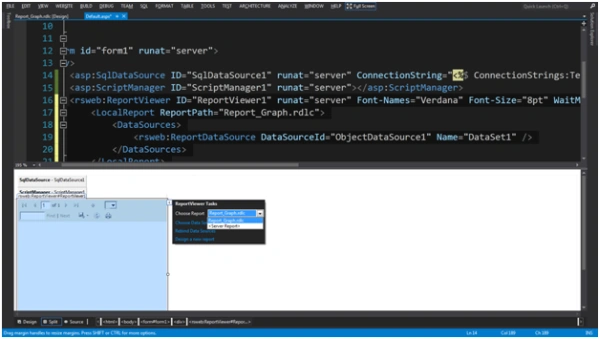
Step 9: Right-click on the "ReportViwer" Control after selecting the "Default.aspx" page and choose the "Report_Graph.rdlc" and save the page.
Step 10: Now run the page and see the output.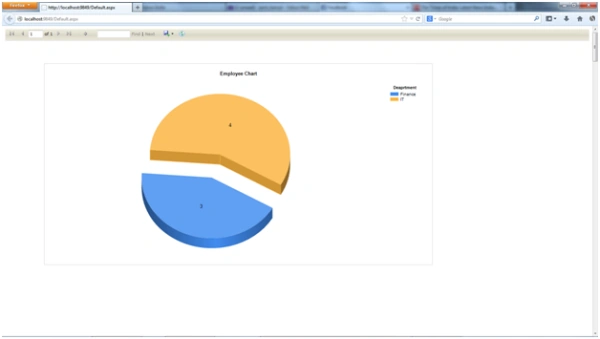
Result: There are 4 employees belonging to the IT Department and 3 employees belonging to Finance.
Vipin MittalPosted Jan 29, 2018, 3:29 AM
Very help full article...thank u sir???????
Rahul BansalPosted Jul 17, 2014, 12:54 AM
Thanks to all...@Prince:-Set some property of ReportViewer like ShowFindControls="false" , ShowRefreshButton="false" ,ShowExportControls="false",ShowPrintButton="false",ShowZoomControl="false" etc.....you hide the controls which you don't want to show.
Prince SharmaPosted Jul 16, 2014, 8:26 AM
Nice work !!! But when I tried it is showing buttons like find , next save ........is there any way to avoid this ???
shyam kalaskarPosted Jul 11, 2014, 3:12 AM
Thanks sir..
yasin mohammadPosted Jun 14, 2014, 2:46 PM
nice Sir...
Rahul BansalPosted Mar 13, 2014, 12:20 AM
@Yan:- Which version you are using like Visual Studio Express for web 2013 ?
Yan ShymanPosted Mar 12, 2014, 3:21 PM
Can I use that on VS express edition? I couldn't find new item "Report" in my version. ..Thx for any help.
Arun GuptaPosted Jan 27, 2014, 7:09 AM
Good rahul keep it up !!