

Introduction
I have one Excel file to be generated from a database, it is available in the attachment with the name bbbb.xlsx.
So first we will convert the Excel data into a DataTable.
Here is the sample code:
- protected void btnUpload_Click(object sender, EventArgs e)
- {
- if (FileUpload1.HasFile)
- {
- string FileName = Path.GetFileName(FileUpload1.PostedFile.FileName);
- string Extension = Path.GetExtension(FileUpload1.PostedFile.FileName);
- string FolderPath = ConfigurationManager.AppSettings["FolderPath"];
- string FilePath = Server.MapPath(FolderPath + FileName);
- FileUpload1.SaveAs(FilePath);
- Import_To_Grid(FilePath, Extension, rbHDR.SelectedItem.Text);
- }
- }
- private void Import_To_Grid(string FilePath, string Extension, string isHDR)
- {
- string conStr = "";
- switch (Extension)
- {
- case ".xls": //Excel 97-03
- conStr = ConfigurationManager.ConnectionStrings["Excel03ConString"].ConnectionString;
- break;
- case ".xlsx": //Excel 07
- conStr = ConfigurationManager.ConnectionStrings["Excel07ConString"].ConnectionString;
- break;
- }
- conStr = String.Format(conStr, FilePath, isHDR);
- OleDbConnection connExcel = new OleDbConnection(conStr);
- OleDbCommand cmdExcel = new OleDbCommand();
- OleDbDataAdapter oda = new OleDbDataAdapter();
- DataTable dt = new DataTable();
- cmdExcel.Connection = connExcel;
- //Get the name of First Sheet
- connExcel.Open();
- DataTable dtExcelSchema;
- dtExcelSchema = connExcel.GetOleDbSchemaTable(OleDbSchemaGuid.Tables, null);
- string SheetName = dtExcelSchema.Rows[0]["TABLE_NAME"].ToString();
- connExcel.Close();
- //Read Data from First Sheet
- connExcel.Open();
- cmdExcel.CommandText = "SELECT * From [" + SheetName + "]";
- oda.SelectCommand = cmdExcel;
- oda.Fill(dt);
- connExcel.Close();
- }
The code above uses a File Upload Control to export an Excel sheet into a DataTable. If the file extension is .xls then it is treated as a (up to) 2003 version but if the file extension is .xlsx then it is treated as a 2007 (and above) version. So finally in this step we must send the data into the data table.
Now, by using this data table we will count the number of duplicate rows. For that purpose we will use the two methods LINQ and the Dictionary class.
- var query = dt.AsEnumerable().GroupBy(r => new { Name = r.Field<string>("F13") }).Select(grp => new
- {
- Name = grp.Key.Name,
- count = grp.Count()
- });
- for (int i = 0; i < query.Count(); i++)
- {
- var item = query.ElementAt(i);
- var itemname = item.Name;
- var itemcount = item.count;
- Response.Write("Name : " + itemname + " - - - - - Count :" + itemcount+ " <br>");
- Response.Write("\n");
- }
- Dictionary<string, int> ds = new Dictionary<string, int>();
- for (int i = 7; i < dt.Rows.Count; i++)
- {
- string s = dt.Rows[i][12].ToString();
- if (ds.ContainsKey(s))
- {
- ds[s] = ds[s] + 1;
- }
- else
- {
- ds.Add(s, 1);
- }
- // data.Add(s);
- }
- for (int i = 0; i < ds.Count(); i++)
- {
- var item = ds.ElementAt(i);
- var itemname = item.Key;
- var itemcount = item.Value;
- Response.Write("Name : " + itemname + " - - - - - Count :" + itemcount + " <br>");
- Response.Write("\n");
- }
Ok. Now if you upload a dddd.xls file the output will be as in the following:
Name : Root cause - - - - - Count :1
Name : OS: Due to oversight or negligence - - - - - Count :10
Name : CODE: Errors in existing code - - - - - Count :13
Name : DA: Data unavailable - - - - - Count :4
Name : CODE: A calculation is incorrect, unclear, or incomplete, Memory Leak, Incomplete or missing code - - - - - Count :4
Name : TEST DATA: Non Availability of Test Data - - - - - Count :8
Name : CODE: An error related to performance/optimality of the code - - - - - Count :3
Name : CODE: Inadequate or incorrect or misleading or missing error messages in source code - - - - - Count :1
Name : DOC: All documentation related causes - - - - - Count :1
Name : MIS COMM: Defects due to Miscommunication - - - - - Count :1
Name : hanu - - - - - Count :2
Has Header?
Now, I want show above the count of the repeated data in the chart. So for this we will use a chart control, it is available in the Toolbox.
- System.Web.UI.DataVisualization.Charting.ChartArea charea= Chart1.ChartAreas[0];
- System.Web.UI.DataVisualization.Charting.DataPointCollection dpc= Chart1.Series[0].Points;
- charea.AxisX.Title = "duplicate data";
- charea.AxisY.Title = "no of duplicate data";
- dpc.AddXY(item.Name, item.count);
The code above should continue the LINQ query of the for loop in the Import_To_grid() method. Here the LINQ properties are item.Name and item.Count as the data source of the chart control.
Note: the LINQ or Dictionary and chart control code should be continued in the Import_To_Grid() method.
You can also download the total program from the attachment.
When you run this program you'll get the output as below: 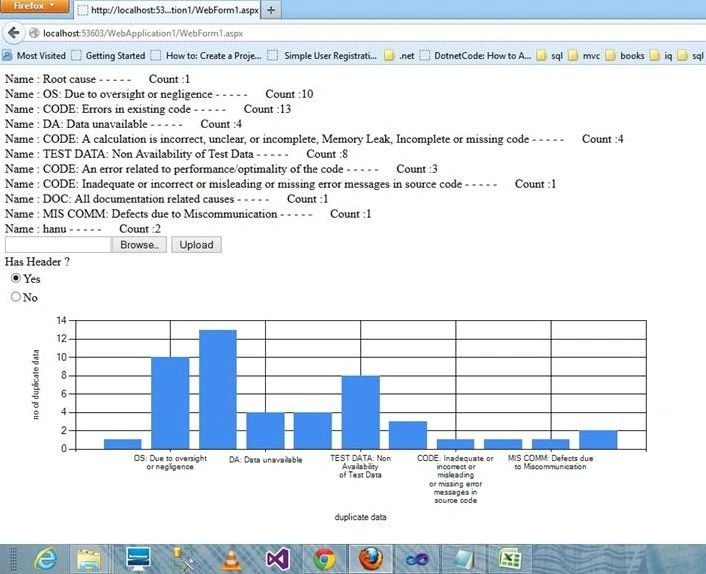
I hope it will be helpful for you. Please post your comments.
Thank you!
Faisal SaghirPosted Aug 11, 2015, 3:57 AM
great job
Dinesh BeniwalPosted Sep 24, 2014, 10:22 AM
Good start Hanumantharao, welcome to C# Corner.