

The following is the procedure to record and conduct load testing with JMETER.
JMETER
Apache JMeter is a 100% pure Java Desktop application designed to load-test functional behavior and measure performance. It was originally designed for testing Web Applications but has since expanded to other test functions. JMeter can be used as a unit test tool for JDBC database connections, FTP, LDAP, Web services and JMS.
If you are not aware of the basics related to JMETER then please refer to the following link for 10 min before reading this complete article.
http://jmeter.apache.org/usermanual/build-web-test-plan.html
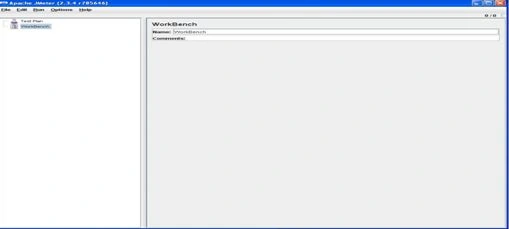
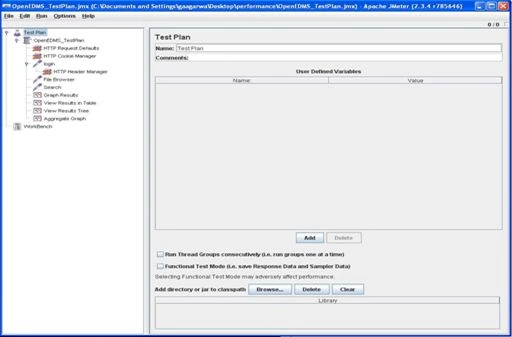
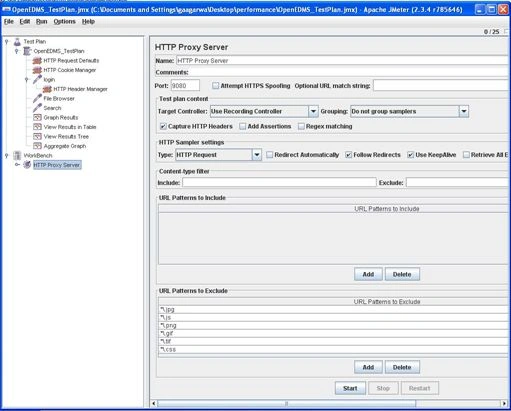
The JMETER tool looks difficult to understand quickly since the new user does not have the basic knowledge to create a load test environment. This article will concentrate only on one of the best ways to record a web application using Workbench (file provided in code files) and run load tests in a similar way, like fro example QTP or Visual Studio - CodedUI.
Difference between performance and load testing 
Load Testing Tools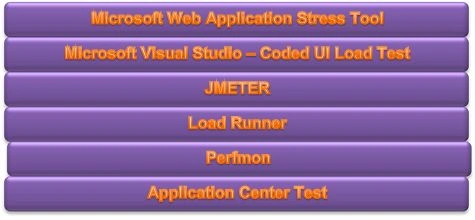
Various types of load test variants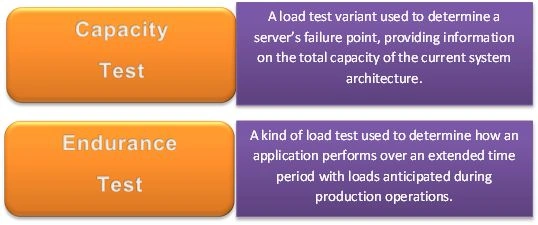
Example of Requirement of load testing:
- Given a load of 50 requests per second for this URL and no other requests
- Within database CPU utilization and under 20% and Web Server CPU utilization of under 10%
To analyze the load testing results:
- To check the performance of the web page the average value of receiving the page is an important parameter to check
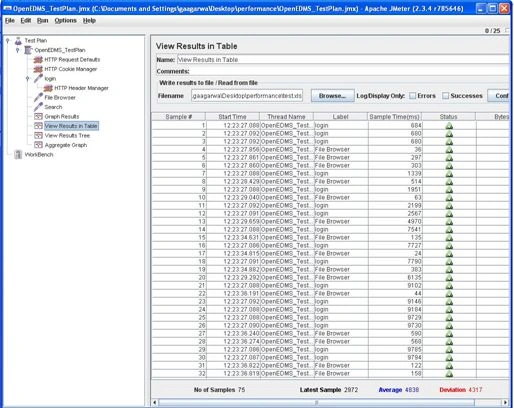
- Samples: A sample means one sampler call. One request to a web page in our case. So the value of 51 means a total of 51 web page requests to the page, for example "http://www.google.com", were made by JMeter
- Average: This value is the average time taken to receive the web pages. There were 51 values of receiving time that were added and divided by 51 and this value is arrived by JMeter. This value is a measure of performance of this web page. This means on an average 334 milliseconds is required to receive this web page for our network conditions.
- Min and Max: These are the minimum and maximum values of time required for receiving the web page.
- Std. Dev: This shows how many exceptional cases were found that were deviating from the average value of the receiving time. The lesser this value more consistent the time pattern is assumed.
- Error %: This value indicated the percentage of error. For example 51 calls were made and all are received successfully this means 0 error. If there are any calls not received properly they are counted as errors and the percentage of error occurrence against the actual calls made is displayed in this value.
Terminology
Before we dive into the step-by-step instructions, it's a good idea to define the terms and ensure the definition is clear.
Master: the system running Jmeter GUI, that controls the test
Slave: the system running jmeter-server, that takes commands from the GUI and send requests to the target system(s)
Target: the webserver we plan to stress test
Note: Starting the Test
Before start load testing, if you want to double check that the slave systems are working then open jmeter.log in Notepad. You should see the following in the log. Jmeter.engine.RemoteJMeterEngineImpl: Starting backing engine. If you do not see this message then it means the JMETER server did not start correctly.




Satyender SainiPosted Mar 6, 2017, 2:24 AM
Great article to test web application. thanks sir
Gowtham RajamanickamPosted Apr 25, 2015, 5:35 AM
good