

This article explains breakpoints that is one of the most used features by developers to debug applications. Breakpoints break (temporarily halt) execution of a program during runtime at certain point. I will describe the feature provided in Visual Studio for breakpoints and how they are useful for debugging code easily.
What is Breakpoint?
Breakpoints is a feature provided by the debugger in Microsoft Visual Studio that allows breaking execution of code at runtime when debugging applications.
For Example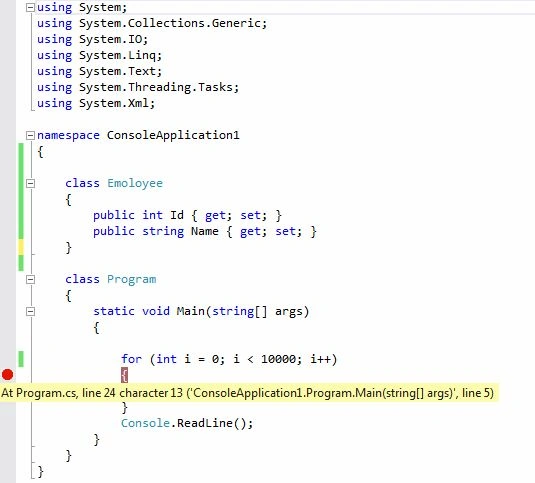
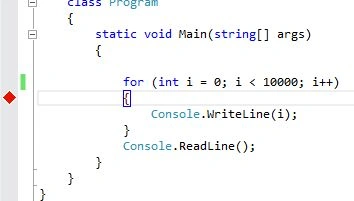
When you click on the side (in the margin) of a line of code in Visual Studio it sets a break point in your code as displayed in the image above. So when you start execution (debug) the code it will break execution at this point.
BreakPoint Menu (Option for the Break)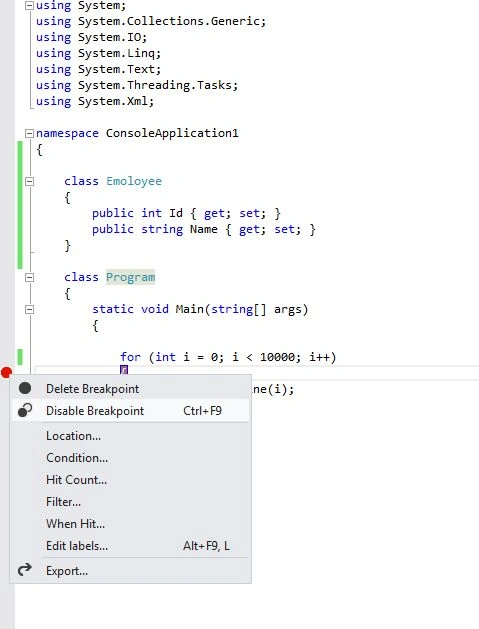
The precediing image shows the context-menu for breakpoints, in other words the breakpoint menu. The following describes all the options one by one.
- Delete Breakpoint
This option of the breakpoint menu allows removal of a breakpoint.
- Disable Breakpoint
This option of the breakpoint menu allows disabling a breakpoint so the breakpoint is just disabled and becomes gray. This is useful when the developer just wants to execute code without stopping at the breakpoint yet later on enable it again when they want to use it again.
- Location…
This menu option allows setting a breakpoint at a specified location, in other words at a given line in the source code file.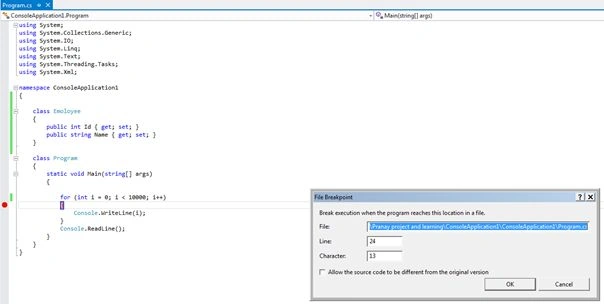
When the menu is clicked a dialog is displayed that provides information about the source code file, line number in code and the character. This dialog allows changing line and character information.
For Example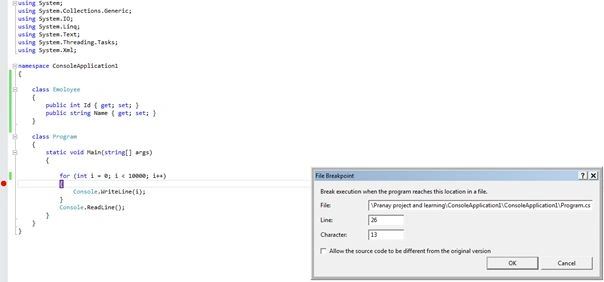
Change the line number to 26 in the dialog and thrn the breakpoint changes to line number 26.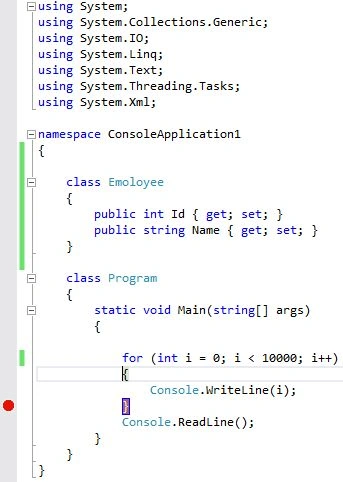
- Condition…
When this option is clicked then the following dialog with two options is displayed.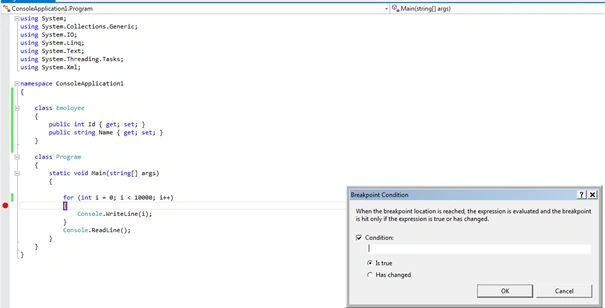
- IS true
This option allows the setting of a condition for a breakpoint, so depending on this, execution during debugging is stopped at the breakpoint, in other words the breakpoint is hit when the condition is satisfied.For Example
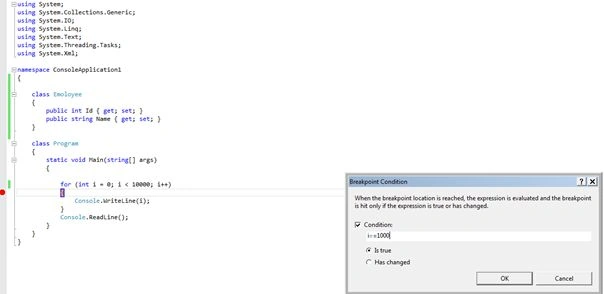
As in the image above the condition "i==1000" is set; that means that this breakpoint is hit when this condition is true, in other words satisfied.
This is very helpful when you want to stop execution of the application when a certain condition is met specially as in an example loop having many number of elements and we want to stop at a given location.
The condition for a breakpoint is set as shown in the following:
The breakpoint is changed to a red icon having a + sign in it. When the mouse is hovered over a breakpoint, Visual Studio displays information related to the breakpoint with its condition in a tooltip.
- Has changed
This option allows breaking execution of code at a breakpoint when there is a change in the variable or object.
For Example
Here the variable "i" is entered into the dialog, in other words if the value of variable "i" changes then execution of the program is halted at the breakpoint.
The following image shows the tooltip on a breakpoint once a condition has been set.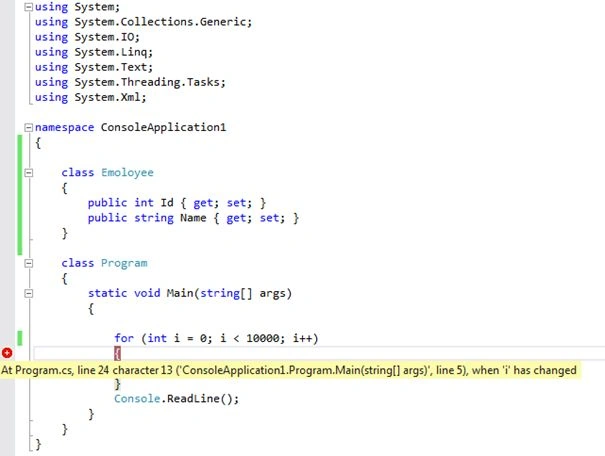
When this option is used then, in the breakpoint context menu, the condition option is checked as in the following image.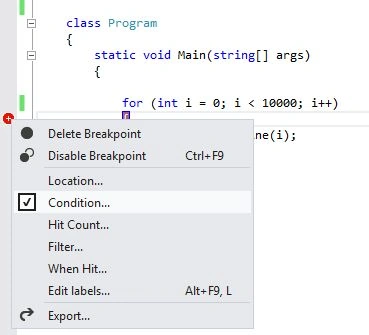
- IS true
- Hit Count..
This option displays the count of the number of times the breakpoint has been hit during execution.
This dialog box has three options that allow the hit count to be set and if the hit count matches then program execution is halted at the breakpoint. Each option is self-explanatory; you can see them in the following image.
- Filter..
This option allows the setting of a condition related to "Machinename and Process" depending on which breakpoint is hit. The following image explains more details about it.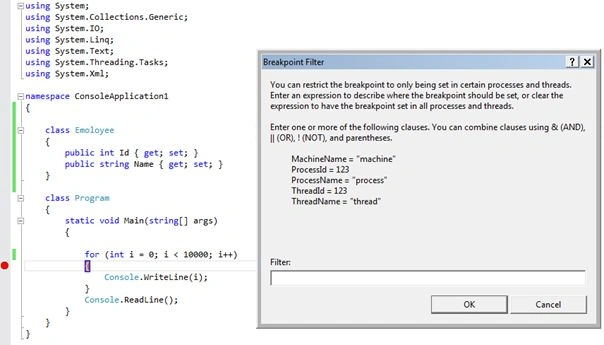
- When Hit...
This option allows the setting of a message that is printed to the Output Window when program executions passes the breakpoint.
This option converts a breakpoint to a Tracepoint, in other words so the developer can do tracing of an import variable or things by printing a message on the Output Window when code at the tracepoint is executed.
For Example
As in the image above, to read the value of the variable the developer created a message that is printed on the Output Window each time code in the for loop is executed.
You can read the text in the dialog that also provides information about how to provide information in the TextBox so that it gets printed to the Output Window.
Once the developer presses Ok, by setting the tracing message the breakpoint is displayed like a square as in the following window.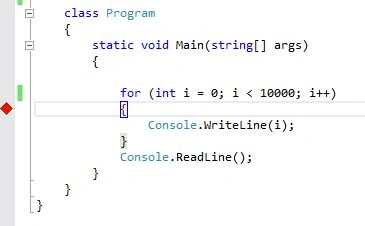
So when this program is debugged in Visual Studio, the messages are printed to the Output Window as shown in the following image.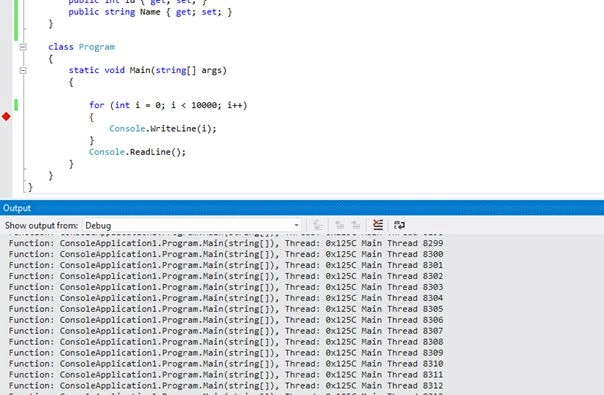
- Edit Labels...
This option allows the setting of labels for your breakpoints. So it displays a dialog as in the following: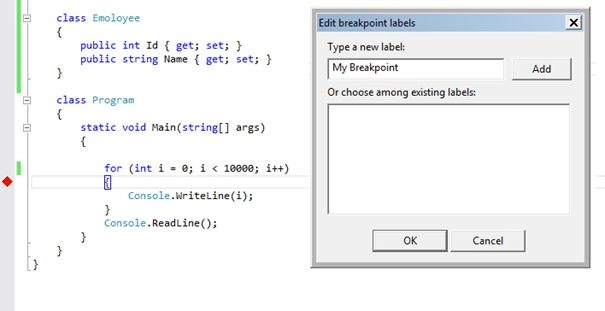
This is helpful for when the developer exports breakpoints from Visual Studio, it helps to remember the importance of breakpoint via a label, the usefulness of a breakpoint using the same name and so on.
- Export..
This option allows exporting of a breakpoint set by the developer.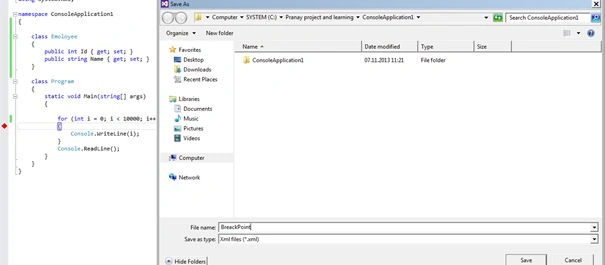
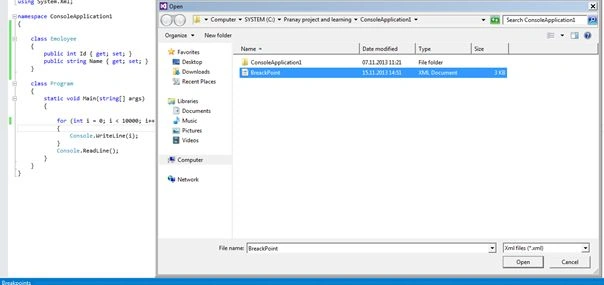
The exported breakpoint information is saved as "XML" as shown in the above image.
Exported XML file for a breakpoint looks as in the following:
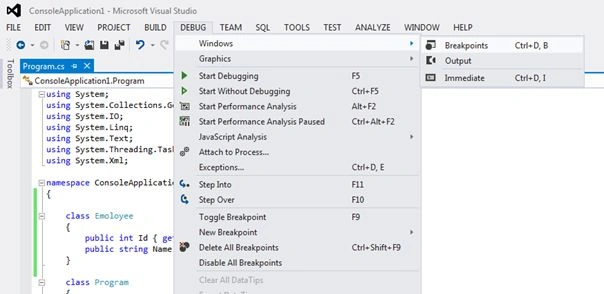
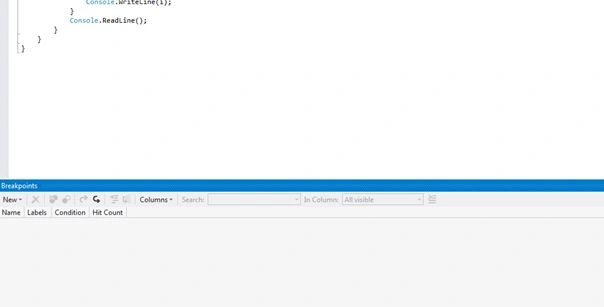
This option is helpful when the developer wants to export a breakpoint and save it as XML then remove it. When there is a need for the same breakpoint he/she can load the breakpoint by loading the XML file using the Debug window of Visual Studio.




Sam HobbsPosted Nov 19, 2013, 12:59 PM
This is a very useful introduction to breakpoints. I think another relevant subject worth mentioning briefly is the watch window and the quick watch window. The quick watch window might not be available in the express edition of VS.
Dinesh BeniwalPosted Nov 19, 2013, 10:43 AM
Great Work, Pranay, Welcome to the C# Corner.