

The following is my SQL Server Data Table with the data I will show in the chart.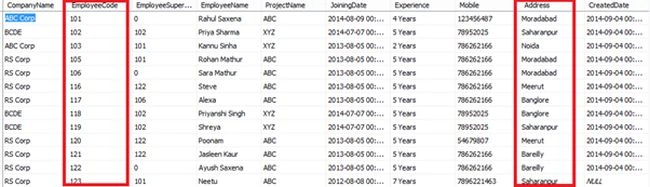
Image 1.
Here I will show the total number of users by their city (Address). The following is my table in design mode.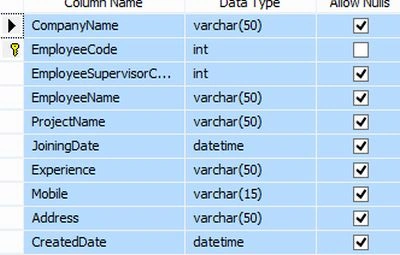
Image 2.
The script of my table is:
- CREATE TABLE [dbo].[Employee](
- [CompanyName] [varchar](50) NULL,
- [EmployeeCode] [int] NOT NULL,
- [EmployeeSupervisorCode] [int] NULL,
- [EmployeeName] [varchar](50) NULL,
- [ProjectName] [varchar](50) NULL,
- [JoiningDate] [datetime] NULL,
- [Experience] [varchar](50) NULL,
- [Mobile] [varchar](15) NULL,
- [Address] [varchar](50) NULL,
- [CreatedDate] [datetime] NULL,
- CONSTRAINT [PK_Employee] PRIMARY KEY CLUSTERED
- (
- [EmployeeCode] ASC
- )WITH (PAD_INDEX = OFF, STATISTICS_NORECOMPUTE = OFF, IGNORE_DUP_KEY = OFF, ALLOW_ROW_LOCKS = ON, ALLOW_PAGE_LOCKS = ON) ON [PRIMARY]
- ) ON [PRIMARY]
- GO
- SET ANSI_PADDING OFF
- GO
- <%@ Page Language="C#" AutoEventWireup="true" CodeBehind="ChartControlDemo.aspx.cs" Inherits="ChartControlApplication.ChartControlDemo" %>
- <%@ Register Assembly="System.Web.DataVisualization, Version=4.0.0.0, Culture=neutral, PublicKeyToken=31bf3856ad364e35" Namespace="System.Web.UI.DataVisualization.Charting" TagPrefix="asp" %>
- <!DOCTYPE html>
- <html xmlns="http://www.w3.org/1999/xhtml">
- <head runat="server">
- <title>Showing Employee Information in Chart</title>
- </head>
- <body>
- <form id="form1" runat="server">
- <div>
- <asp:Chart ID="EmployeeChartInfo" runat="server" Height="450px" Width="550px">
- <Titles>
- <asp:Title ShadowOffset="3" Name="Items" />
- </Titles>
- <Legends>
- <asp:Legend Alignment="Center" Docking="Bottom" IsTextAutoFit="False" Name="Default" LegendStyle="Row" />
- </Legends>
- <Series>
- <asp:Series Name="Default" />
- </Series>
- <ChartAreas>
- <asp:ChartArea Name="ChartArea1" BorderWidth="1" />
- </ChartAreas>
- </asp:Chart>
- </div>
- </form>
- </body>
- </html>
- <?xml version="1.0"?>
- <!--
- For more information on how to configure your ASP.NET application, please visit
- http://go.microsoft.com/fwlink/?LinkId=169433
- -->
- <configuration>
- <appSettings>
- <add key="ChartImageHandler" value="storage=file; timeout=20;" />
- </appSettings>
- <system.web>
- <compilation debug="true" targetFramework="4.5">
- <assemblies>
- <add assembly="System.Web.DataVisualization, Version=4.0.0.0, Culture=neutral, PublicKeyToken=31BF3856AD364E35"/>
- </assemblies>
- </compilation>
- <httpRuntime targetFramework="4.5"/>
- </system.web>
- <system.webServer>
- <handlers>
- <remove name="ChartImageHandler" />
- <add name="ChartImageHandler" preCondition="integratedMode" verb="GET,HEAD,POST"
- path="ChartImg.axd" type="System.Web.UI.DataVisualization.Charting.ChartHttpHandler, System.Web.DataVisualization, Version=4.0.0.0, Culture=neutral, PublicKeyToken=31bf3856ad364e35" />
- </handlers>
- </system.webServer>
- </configuration>
- using System;
- using System.Collections.Generic;
- using System.Linq;
- using System.Web;
- using System.Web.UI;
- using System.Web.UI.WebControls;
- using System.Data;
- using System.Data.SqlClient;
- using System.Web.UI.DataVisualization.Charting;
- namespace ChartControlApplication
- {
- public partial class ChartControlDemo : System.Web.UI.Page
- {
- protected void Page_Load(object sender, EventArgs e)
- {
- if (!IsPostBack)
- {
- GetEmployeeChartInfo();
- }
- }
- private void GetEmployeeChartInfo()
- {
- DataTable dt = new DataTable();
- using (SqlConnection con = new SqlConnection(@"Data Source=MyPC\SqlServer2k8;Integrated Security=true;Initial Catalog=Test"))
- {
- con.Open();
- SqlCommand cmd = new SqlCommand("SELECT Address as Name, COUNT(EMPLOYEECODE) AS Total FROM Employee GROUP BY Address", con);
- SqlDataAdapter da = new SqlDataAdapter(cmd);
- da.Fill(dt);
- con.Close();
- }
- string[] x = new string[dt.Rows.Count];
- int[] y = new int[dt.Rows.Count];
- for (int i = 0; i < dt.Rows.Count; i++)
- {
- x[i] = dt.Rows[i][0].ToString();
- y[i] = Convert.ToInt32(dt.Rows[i][1]);
- }
- EmployeeChartInfo.Series[0].Points.DataBindXY(x, y);
- EmployeeChartInfo.Series[0].ChartType = SeriesChartType.Pie;
- EmployeeChartInfo.ChartAreas["ChartArea1"].Area3DStyle.Enable3D = true;
- EmployeeChartInfo.Legends[0].Enabled = true;
- }
- }
- }
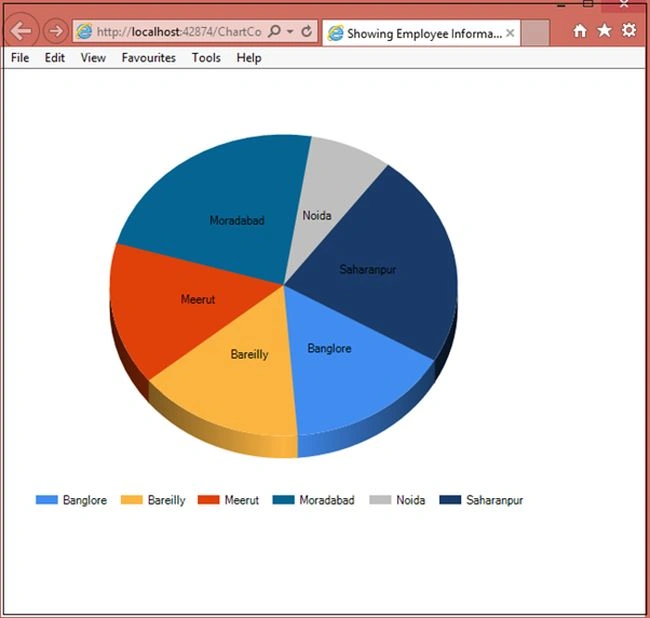
Image 3.
Join the conversation! Your thoughts help the community grow.