

The following is my SQL Server Data Table with the data I will show in the chart.
Image 1.
Here I will show the total number of users by their city (Address). The following is my table in design mode.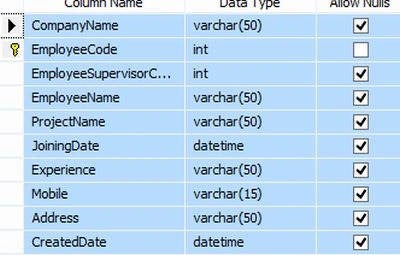
Image 2.
The following is the script of my table:
- CREATE TABLE [dbo].[Employee](
- [CompanyName] [varchar](50) NULL,
- [EmployeeCode] [int] NOT NULL,
- [EmployeeSupervisorCode] [int] NULL,
- [EmployeeName] [varchar](50) NULL,
- [ProjectName] [varchar](50) NULL,
- [JoiningDate] [datetime] NULL,
- [Experience] [varchar](50) NULL,
- [Mobile] [varchar](15) NULL,
- [Address] [varchar](50) NULL,
- [CreatedDate] [datetime] NULL,
- CONSTRAINT [PK_Employee] PRIMARY KEY CLUSTERED
- (
- [EmployeeCode] ASC
- )WITH (PAD_INDEX = OFF, STATISTICS_NORECOMPUTE = OFF, IGNORE_DUP_KEY = OFF, ALLOW_ROW_LOCKS = ON, ALLOW_PAGE_LOCKS = ON) ON [PRIMARY]
- ) ON [PRIMARY]
- GO
- SET ANSI_PADDING OFF
- GO
- <%@ Page Language="C#" AutoEventWireup="true" CodeBehind="jQueryGoogleChart.aspx.cs" Inherits="jQueryChartApplication.jQueryGoogleChart" %>
- <!DOCTYPE html>
- <html xmlns="http://www.w3.org/1999/xhtml">
- <head runat="server">
- <title></title>
- <script src="http://code.jquery.com/jquery-1.8.2.js"></script>
- <script src="http://www.google.com/jsapi" type="text/javascript"></script>
- <script type="text/javascript">
- google.load('visualization', '1', { packages: ['corechart'] });
- </script>
- <script type="text/javascript">
- $(function () {
- $.ajax({
- type: 'POST',
- dataType: 'json',
- contentType: 'application/json',
- url: 'jQueryGoogleChart.aspx/GetChartData',
- data: '{}',
- success:
- function (response) {
- drawchart(response.d);
- },
- error: function () {
- alert("Error loading data!");
- }
- });
- })
- function drawchart(dataValues) {
- var data = new google.visualization.DataTable();
- data.addColumn('string', 'Column Name');
- data.addColumn('number', 'Column Value');
- for (var i = 0; i < dataValues.length; i++) {
- data.addRow([dataValues[i].EmployeeCity, dataValues[i].Total]);
- }
- new google.visualization.PieChart(document.getElementById('myChartDiv')).
- draw(data, { title: "Google Chart in Asp.net using jQuery" });
- }
- </script>
- </head>
- <body>
- <form id="form1" runat="server">
- <div id="myChartDiv" style="width: 700px; height: 450px;">
- </div>
- </form>
- </body>
- </html>
- using System;
- using System.Collections.Generic;
- using System.Linq;
- using System.Web;
- using System.Web.UI;
- using System.Web.UI.WebControls;
- using System.Data;
- using System.Data.SqlClient;
- using System.Web.Services;
- namespace jQueryChartApplication
- {
- public partial class jQueryGoogleChart : System.Web.UI.Page
- {
- protected void Page_Load(object sender, EventArgs e)
- {
- }
- [WebMethod]
- public static List<employeeDetails> GetChartData()
- {
- DataTable dt = new DataTable();
- using (SqlConnection con = new SqlConnection(@"Data Source=MyPC\SqlServer2k8;Integrated Security=true;Initial Catalog=Test"))
- {
- con.Open();
- SqlCommand cmd = new SqlCommand("SELECT Address as Name, COUNT(EMPLOYEECODE) AS Total FROM Employee GROUP BY Address", con);
- SqlDataAdapter da = new SqlDataAdapter(cmd);
- da.Fill(dt);
- con.Close();
- }
- List<employeeDetails> dataList = new List<employeeDetails>();
- foreach (DataRow dtrow in dt.Rows)
- {
- employeeDetails details = new employeeDetails();
- details.EmployeeCity = dtrow[0].ToString();
- details.Total = Convert.ToInt32(dtrow[1]);
- dataList.Add(details);
- }
- return dataList;
- }
- public class employeeDetails
- {
- public string EmployeeCity { get; set; }
- public int Total { get; set; }
- }
- }
- }

Image 3.
Now hover the mouse on the chart.
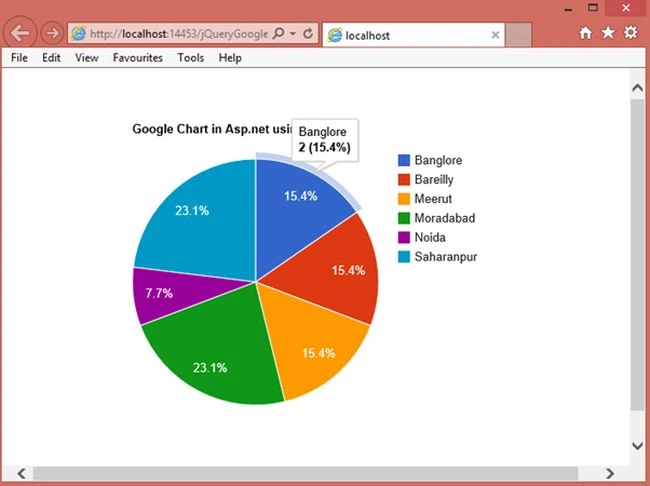
Image 4.
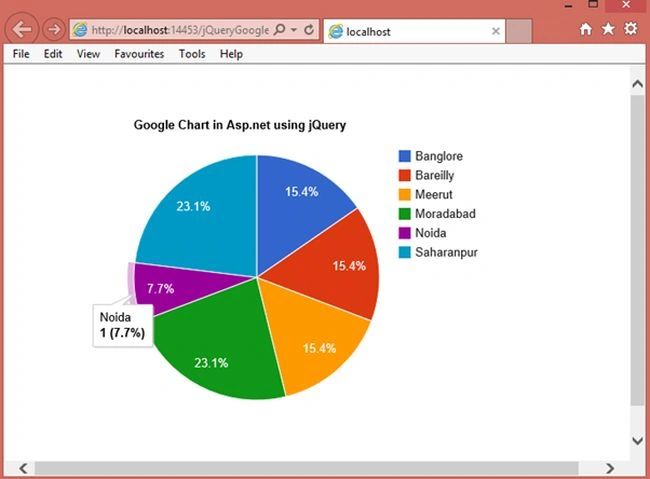
Image 5.
jamila jamilPosted Apr 25, 2020, 12:09 PM
Please why its didn't work in my project just in yours
Javed AlamPosted Sep 4, 2018, 1:07 AM
Its not working sir. Chart not diplay yet. datavalues are not getting.
Leonardo Marquez MoriPosted Jun 11, 2018, 5:06 PM
Excelente hermano me as ayudado un monton
Lokesh RavindraPosted May 17, 2018, 1:30 AM
How to change colors for the cities ?
RafaelPosted Mar 19, 2018, 11:11 PM
Hello! And if you need to load two charts from different SQL queries? Tks!!!
Vijay GuptaPosted Jan 1, 2018, 12:37 AM
<script src="http://code.jquery.com/jquery-1.8.2.js"> error is coming this line hoe can solve in visual studio 2010
Vijay GuptaPosted Jan 1, 2018, 12:07 AM
Description: An error occurred during the parsing of a resource required to service this request. Please review the following specific parse error details and modify your source file appropriately. Parser Error Message: Could not load type 'jQueryChartApplication.jQueryGoogleChart'.
soma navinPosted Oct 16, 2015, 2:47 AM
hello rahul saxena..Very nice article ...But Here I want to change color of the pie chart..Can u please me with this..?
Manish Kumar ChoudharyPosted Dec 14, 2014, 4:25 AM
nice one ...
Pramod LawatePosted Dec 14, 2014, 12:38 AM
very nice