

In SQL Server, the query optimizer uses a cardinality estimator to answer data SELECTIVITY questions like the ones below. The optimizer uses this cardinality data, which relies heavily on the statistics to get the answers and calculate a cost estimate. It takes the # of Rows to satisfy a Predicate/Total # of Input Rows.
- How many rows will satisfy a single filter predicate? Multiple?
- WHERE
- How many rows will satisfy a join predicate between two tables?
- JOIN
- How many distinct values do we expect from a specific column?
- DISTINCT
- GROUP BY
From this estimate, the optimizer is able to find an efficient execution plan that fulfills a query request. You will note that query optimizer, including SQL Server, does not generate all possible plans, it creates several then chooses a good enough plan to return results requested. This behavior gives us the most efficient processing strategy (generating plans is computationally expensive, hence the limited number) for executing queries across a wide variety of workloads.
Here I will go over five ways we can see the estimations it creates, some of which I am sure you are already aware of and hopefully use daily. Note that items four and five in the picture below are starred. This denotes that they are very resource intensive to run. I highly suggest if you use those options you only keep them running for a very short interval to capture what you want and then turn them off.

First, we will look at SET STATISTICS XML. It’s set in a simple T-SQL Statement and remains on until set to off. The results return an XML link to the actual execution plan.
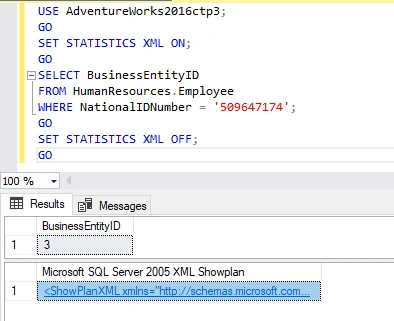

Including the actual execution plan is something we should all already be using (in testing--remember it’s expensive to capture actual plans) to see runtime information, actual resource usage metrics and runtime warnings.
There are a variety of methods for displaying or triggering graphical execution plans
- Under the Query menu in SSMS, click Include Actual Execution Plan
- Include Actual Execution Plan toolbar button
- Use the SET STATISTICS XML ON T-SQL statement
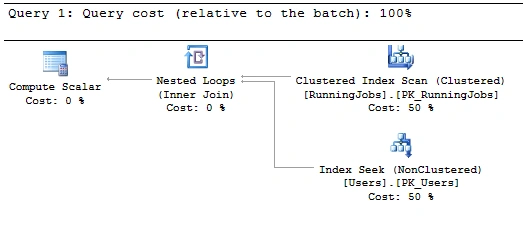
Costs are displayed for each step, relative to the total cost of the query plan,
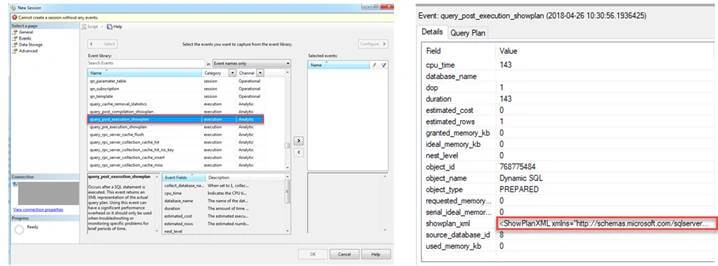
If you are a fan of Extended Events you may already be familiar with Query_post_execution_showplan. It also returns an XML link to the actual execution plan along with estimate counts and costs.
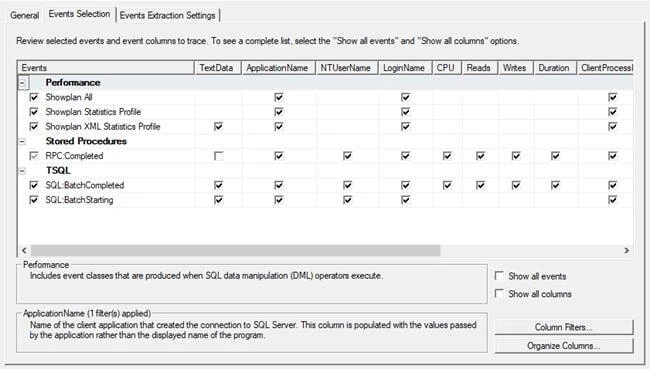
Lastly, for those die-hard “Profiler for Life” DBA’s there are traces you can add to capture this information as well. When creating the trace look under Performance and choose the following.
- Showplan ALL
- Showplan Statistics Profile
- Showplan XML Statistics Profile.

It's important to know these ways to get to execution plans and cardinality estimates. When diving into query performance issues these are key to discovering your bottlenecks and plan deficiencies.
Now, I know, in this blog I refer to the cardinality estimator’s reliance on statistics for its calculation, but I really didn’t go into statistics much. Look to next week as I dive into those. SI'll start with DBCC SHOW_STATISTICS and how over and underestimations due to bad statics can lead to inefficient plans.
Hadshana KamalanathanPosted Jul 15, 2018, 7:54 PM
Thank you for sharing