

Python PANDAS
In the previous article, we studied NumPy, its functions, and their python implementations. In this article, we will be studying each of the pandas functions and their python implementation.
What is Pandas in Python?
Pandas is a software library written for the Python programming language for data manipulation and analysis. In particular, it offers data structures and operations for manipulating numerical tables and time series. It is free software released under the three-clause BSD license. The name is derived from the term "panel data", a term for data sets that include observations over multiple periods for the same individuals.
The original author is Wes McKinney. Pandas were first released on 11 January 2008. The official website is www.pandas.pydata.org
Uses of Pandas in Python
- DataFrame object for data manipulation with integrated indexing.
- Tools for reading and writing data between in-memory data structures and different file formats.
- Data alignment and integrated handling of missing data.econometrics
- Reshaping and pivoting of data sets.
- Label-based slicing, fancy indexing, and subsetting of large data sets.
- Data structure column insertion and deletion.
- Group by engine allowing split-apply-combine operations on data sets.
- Data set merging and joining.
- Hierarchical axis indexing to work with high-dimensional data in a lower-dimensional data structure.
- Time series-functionality: Date range generation and frequency conversion, moving window statistics, moving window linear regressions, date shifting, and lagging.
- Provides data filtration.
Installing Pandas in Python
1. Ubuntu/Linux
- sudo apt update -y
- sudo apt upgrade -y
- sudo apt install python3-tk python3-pip -y
- sudo pip install numpy -y
- conda install -c anaconda pandas
Note:
Please download the attached file
Input and Output using Python Pandas
1. Reading and Writing CSV
a. pandas.read_csv()
This is function is used to read CSV or comma-separated values files
Syntax
pandas.read_csv(filepath_or_buffer: Union[str, pathlib.Path, IO[~AnyStr]], sep=',', delimiter=None, header='infer', names=None, index_col=None, usecols=None, squeeze=False, prefix=None, mangle_dupe_cols=True, dtype=None, engine=None, converters=None, true_values=None, false_values=None, skipinitialspace=False, skiprows=None, skipfooter=0, nrows=None, na_values=None, keep_default_na=True, na_filter=True, verbose=False, skip_blank_lines=True, parse_dates=False, infer_datetime_format=False, keep_date_col=False, date_parser=None, dayfirst=False, cache_dates=True, iterator=False, chunksize=None, compression='infer', thousands=None, decimal=b'.', lineterminator=None, quotechar='"', quoting=0, doublequote=True, escapechar=None, comment=None, encoding=None, dialect=None, error_bad_lines=True, warn_bad_lines=True, delim_whitespace=False, low_memory=True, memory_map=False, float_precision=None)\
In the above code, we are reading the 'titanic.csv' file and converting it to DataFrame object
- import pandas as pd
- df = pd.read_csv('titanic.csv', header=None, nrows=10)
- print(df)
b. DataFrame.to_csv()
This is function is used to write to CSV or comma-separated values files
Syntax
DataFrame.to_csv(self, path_or_buf=None, sep=', ', na_rep='', float_format=None, columns=None, header=True, index=True, index_label=None, mode='w', encoding=None, compression='infer', quoting=None, quotechar='"', line_terminator=None, chunksize=None, date_format=None, doublequote=True, escapechar=None, decimal='.')
The above code will create a new file named new.csv which will contain data
Syntax
pandas.read_excel(io, sheet_name=0, header=0, names=None, index_col=None, usecols=None, squeeze=False, dtype=None, engine=None, converters=None, true_values=None, false_values=None, skiprows=None, nrows=None, na_values=None, keep_default_na=True, verbose=False, parse_dates=False, date_parser=None, thousands=None, comment=None, skip_footer=0, skipfooter=0, convert_float=True, mangle_dupe_cols=True, **kwds)
The above code will read 10 rows from titanic.xslx and will write them to DataFrame df
- import pandas as pd
- data = {'Name':['C','Sharp','Corner'], 'Age':[20,21,22], 'Address':['Delhi','Kanpur','Tamil Nadu']}
- df = pd.DataFrame(data)
- df.to_csv('new.csv')
2. Reading and Writing to Excel
a. pandas.read_excel()
This is function is used to read excel files
- import pandas as pd
- df = pd.read_excel('titanic.xlsx', header=None, nrows=10)
- print(df)
b. pandas.to_excel()
This is function is used to write excel files
Syntax
DataFrame.to_excel(self, excel_writer, sheet_name='Sheet1', na_rep='', float_format=None, columns=None, header=True, index=True, index_label=None, startrow=0, startcol=0, engine=None, merge_cells=True, encoding=None, inf_rep='inf', verbose=True, freeze_panes=None)
The above code will write pandas.DataFrame df to new.xlsx
Syntax
DataFrame.to_json(self, path_or_buf=None, orient=None, date_format=None, double_precision=10, force_ascii=True, date_unit='ms', default_handler=None, lines=False, compression='infer', index=True
The above will convert pandas.DataFrame to json and write it to titanic.json
- import pandas as pd
- data = {'Name':['C','Sharp','Corner'], 'Age':[20,21,22], 'Address':['Delhi','Kanpur','Tamil Nadu']}
- df = pd.DataFrame(data)
- df.to_excel('new.xlsx')
3. Reading and Writing from JSON
a. pandas.read_json()
This is function is used to read JSON or JavaScript Object Notation file
Syntax
pandas.read_json(path_or_buf=None, orient=None, typ='frame', dtype=None, convert_axes=None, convert_dates=True, keep_default_dates=True, numpy=False, precise_float=False, date_unit=None, encoding=None, lines=False, chunksize=None, compression='infer')
The above code will read the titanic.json file and convert the data to pandas.DataFrame object
- import pandas as pd
- df = pd.read_json('titanic.json')
- print(df)
b. DataFrame.to_json()
This is function is used to write to JSON or JavaScript Object Notation file
- import pandas as pd
- data = {'Name':['C','Sharp','Corner'], 'Age':[20,21,22], 'Address':['Delhi','Kanpur','Tamil Nadu']}
- df = pd.DataFrame(data)
- df.to_json('new.json')
Pandas Data Structure
1. Pandas Series
Syntax
pandas.Series(data=None,index=None, dtype=None, name=None, copy=False, fastpath=False)
It is a 1D ndarray with labels, these labels can be unique, but there is no compulsion on them being unique. It supports both integer and label based indexing. Pandas series has a bunch of methods for performing various operations on it.
- import pandas as pd
- s = pd.Series([1, 2, 3, 4], index = ['A', 'B', 'C', 'D'])
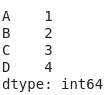
In the following, we are converting a numpy ndarray to pandas series
- import pandas as pd
- import numpy as np
- data = np.array(['c','s','h','a','r','p'])
- s = pd.Series(data)
- print (s)
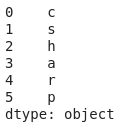
Note:
the default index of the pandas series is 0, 1, 2 .....
Pandas Series Slicing
Slicing means to extract only a part of the given data structure
-
- import pandas as pd
- import numpy as np
- data = np.array(['c','s','h','a','r','p','c','o','r','n','e','r'])
- s = pd.Series(data)
- print(s[:4])
The code will output the following: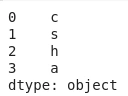
-
The output of the above code wil be:
- import pandas as pd
- import numpy as np
- data = np.array(['c','s','h','a','r','p','c','o','r','n','e','r'])
- s = pd.Series(data)
- print(s[5:])
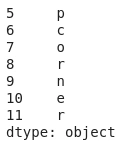
-
The output of the above code will be:
- import pandas as pd
- import numpy as np
- data = np.array(['c','s','h','a','r','p','c','o','r','n','e','r'])
- s = pd.Series(data)
- print(s[1:6])
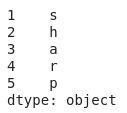
-
The output of the above code will be c
- import pandas as pd
- import numpy as np
- data = np.array(['c','s','h','a','r','p','c','o','r','n','e','r'])
- s = pd.Series(data)
- print(s[6])
Python Pandas Series Functions
Following are a list of functions under by pandas series library
| Function | Description |
| add() | It is used to add series or list-like objects with the same length to the caller series |
| sub() | It is used to subtract series or list-like objects with the same length from the caller series |
| mul() | It is used to multiply series or list-like objects with the same length as the caller series |
| div() | It is used to divide series or list-like objects with the same length by the caller series |
| sum() | It returns the sum of the values for the requested axis |
| prod() | It returns the product of the values for the requested axis |
| mean() | It returns the mean of the values for the requested axis |
| pow() | It is used to put each element of passed series as exponential power of caller series and returns the results |
| abs() | It is used to get the absolute numeric value of each element in Series/DataFrame |
| conv() | It is used to return the covariance of two series |
| combine_first() | It is used to combine two series into one |
| count() | It returns the number of non-NA/null observations in the series |
| size() | It returns the number of elements in the underlying data |
| name() | It is used to give a name to a series object i.e to the column |
| is_unique() | It returns boolean if values in the object are unique |
| idxmax() | It is used to extract the index positions of the highest values in the Series |
| idxmin() |
It is used to extract the index positions of the lowest values in the Series
|
| sort_values() | It is used to sort values of a series in ascending or descending order |
| sort_index() | It is used to sort the indexes of a series in ascending or descending order |
| head() | It is used to return a series of a specified number of rows from the beginning of a Series |
| tail() | It is used to return a series of a specified number of rows from the end of a Series |
| le() | It is used to compare every element of the caller series with the passed series. It returns true for every element which is less than or equal to the element in passed series |
| ne() | It is used to compare every element of the caller series with the passed series. It returns true for every element which is not equal to the element in passed series |
| ge() | It is used to compare every element of the caller series with the passed series. It returns true for every element which is greater than or equal to the element in passed series |
| eq() | It is used to compare every element of the caller series with the passed series. It returns true for every element which is equal to the element in passed series |
| gt() | It is used to compare every element of the caller series with the passed series. It returns true for every element which is greater than the element in passed series |
| lt() | It is used to compare every element of the caller series with the passed series. It returns true for every element which is less than the element in passed series |
| clip() | It is used to clip values below and above the passed least and max values |
| clip_lower() | It is used to clip values below a passed least value |
| clip_upper() | It is used to clip values above a passed maximum value |
| astype() | It is used to change the type of a series |
| tolist() | It is used to convert series to list |
| get() | It is used to extract values from a series |
| unique() | It is used to see the unique values in a particular column |
| nunique() | It is used to count the unique values |
| value_counts() | It is used to count the number of times each unique values occurs in a series |
| factorize() | It is used to get the numeric representation of an array( which is then converted to series) by identifying distinct values |
| map() | It is used to tie together the values from one object to another |
| between() | It is used to check which values lie between the 1st and 2nd argument |
| apply() | It is used for executing custom operations that are not included in pandas or NumPy |
2. Pandas DataFrame
It is a 2D size-mutable, potentially heterogeneous tabular labeled data structure with columns of potentially different types.
Pandas DataFrame consists of 3 principal components, the data, rows, and columns.
Pandas DataFrame output automatically inserts the index, default index is 1,2,3 ......
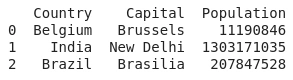
- data = {'Country': ['Belgium', 'India', 'Brazil'],'Capital': ['Brussels', 'New Delhi', 'Brasilia'],'Population': [11190846, 1303171035, 207847528]}
- df = pd.DataFrame(data,columns=['Country', 'Capital', 'Population'])
The above code, will output the following:
- import pandas as pd
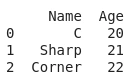
- data = {'Name':['C','Sharp','Corner'], 'Age':[20,21,22]}
- df = pd.DataFrame(data)
The above code, will output the following:
Pandas DataFrame Column Selection
- import pandas as pd
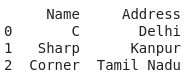
- data = {'Name':['C','Sharp','Corner'], 'Age':[20,21,22], 'Address':['Delhi','Kanpur','Tamil Nadu']}
- df = pd.DataFrame(data)
- print(df[['Name','Address']])
The above code, will output the following:
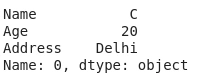
Pandas DataFrame Rows Selection
- import pandas as pd
- data = {'Name':['C','Sharp','Corner'], 'Age':[20,21,22], 'Address':['Delhi','Kanpur','Tamil Nadu']}
- df = pd.DataFrame(data)
- data1= df.loc[0]
- print(data1)
Pandas DataFrame Checking Missing Data Value(s)
To handle missing values, we use two functions i.e.
isnull() and notnull()1. isnull()
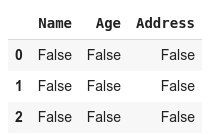
this function checks if the DataFrame element is empty. It returns true if the data is missing, else it will return false
2. notnull()
this function checks if the DataFrame element is not empty. It returns false if the data is missing, else it will return true
- import pandas as pd
- data = {'Name':['C','Sharp','Corner'], 'Age':[20,21,22], 'Address':['Delhi','Kanpur','Tamil Nadu']}
- df = pd.DataFrame(data)
- df.isnull()
Pandas DataFrame Filling Missing Values
Earlier we checked if the values are empty or not, and if any value is missing then we can fill the values using
fillna(), replace() and interpolate()1. DataFrame.fillna()
Syntax
fillna(self, value=None, method=None, axis=None, inplace=None, limit=None, downcast=None, **kwargs)
this function will replace the NaN value with the passed values
- import pandas as pd
- import numpy as np
- data = {'Name':[np.nan,'Sharp','Corner'], 'Age':[20,np.nan,22], 'Address':[np.nan,'Kanpur','Tamil Nadu']}
- df = pd.DataFrame(data)
- df.fillna(0)
the output of the above code will be:
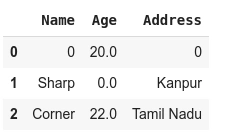
In the above code, we are replacing all "NaN" values with "0"
2. DataFrame.replace()
Syntax
replace(self, to_replace=None, value =None, inplace=None, Limit=None, regex=None, method='pad')
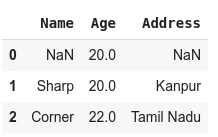
values of DataFrame are replaced with other values dynamically.
- import pandas as pd
- import numpy as np
- data = {'Name':[np.nan,'Sharp','Corner'], 'Age':[20,np.nan,22], 'Address':[np.nan,'Kanpur','Tamil Nadu']}
- df = pd.DataFrame(data)
- df.replace()
3. DataFrame.interpolate()
Syntax
interpolate(self, method='linear', axis=0, limit=None, inplace=False, limit_direction='forward', limit_area=None, downcast=None, **kwargs)
This function is used to fill NA values based upon different interpolation techniques
- import pandas as pd
- import numpy as np
- data = {'Name':[np.nan,'Sharp','Corner'], 'Age':[20,np.nan,22], 'Address':[np.nan,'Kanpur','Tamil Nadu']}
- df = pd.DataFrame(data)
- df.interpolate()
the output of the above code will be:
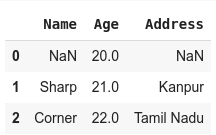
In the above output, we performed linear interpolation. Since at the time of row zero we don't have any previous value hence they cannot be replaced with interpolated value.
Pandas DataFrame Dropping Missing Values
It is often seen that having incomplete knowledge is more dangerous than having no knowledge. So to save guard us against such a situation we delete the incomplete data and keep only those data rows that are complete in themselves. For this, we use
dropna().- import pandas as pd
- import numpy as np
- data = {'Name':[np.nan,'Sharp','Corner'], 'Age':[20,np.nan,22], 'Address':[np.nan,'Kanpur','Tamil Nadu']}
- df = pd.DataFrame(data)
- df.dropna()
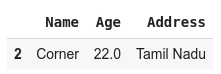
In the above output, you can see that only row 2 is in the output, this is because row 0 & 1 had NaN values.
1. Iterating Over Pandas DataFrame Rows
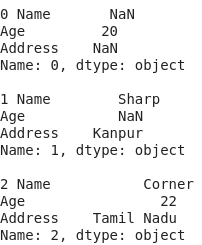
DataFrame.iterrows()
It is used to get each element of each row
The output of the above code will be:
- import pandas as pd
- import numpy as np
- data = {'Name':[np.nan,'Sharp','Corner'], 'Age':[20,np.nan,22], 'Address':[np.nan,'Kanpur','Tamil Nadu']}
- df = pd.DataFrame(data)
- for i, j in df.iterrows():
- print(i,j)
- print()
- import pandas as pd
- import numpy as np
- data = {'Name':[np.nan,'Sharp','Corner'], 'Age':[20,np.nan,22], 'Address':[np.nan,'Kanpur','Tamil Nadu']}
- df = pd.DataFrame(data)
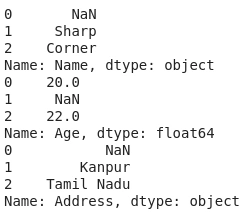
- col = list(df)
- for i in col:
- print(df[i])
Python Pandas DataFrame Functions
Following are a list of functions under by pandas series library
| Function | Description |
| index() | It returns index (row labels) of the DataFrame |
| insert() | it inserts a cloumn into a DataFrame |
| add() | It returns addition of DataFrame and other, element-wise, it is equivalent to binary add |
| sub() | It returns subtraction of DataFrame and other, elementwise, it is equivalent to binary sub |
| mul() | It returns multiplication of DataFrame and other, elementwise, it is equivalent to binary mul |
| div() | It returns floating division of DataFrame and other, elementwise, it is equivalent to binary truediv |
| unique() | It extracts the unique values in the DataFrame |
| nunique() | It returns the count of the unique value in DataFrame |
| value_counts() | It counts the number of times each unique value occurs within the Series |
| columns() | It returns the column labels of the DataFrame |
| axes() | It returns a list representing the axes of the DataFrame |
| isnull() | It creates a Boolean Series for extracting rows with null values |
| notnull() | It creates a Boolean Series for extracting rows with non-null values |
| between() | It extracts rows where a column value falls in between a predefined range |
| isin() | It extracts rows from a DataFrame where a column value exists in a predefined collection |
| dtypes() | It returns a Series with the data type of each column. The result's index is the original DataFrame's columns |
| astypes() | It converts the data types in a Series |
| values() | It returns a Numpy representation of the DataFrame i.e. axes labels will be removed |
| sort_values()- Set, Set2 | It sorts a DataFrame in Ascending or Descending order of passed column |
| sort_index() | It sorts the values in a DataFrame based on their index positions or labels instead of their values but sometimes a DataFrame is made out of two or more DataFrames and hence later index can be changed using this method |
| loc() | It retrieves rows based on an index label |
| iloc() | It retrieves rows based on an index position |
| ix() | It retrieves DataFrame rows based on either index label or index position. This method is the best combination of loc() and iloc() methods |
| rename() | It is used to change the names of the index labels or column names |
| columns() | It is used to change the column name |
| drop() | It is used to delete rows or columns from a DataFrame |
| pop() | It is used to delete rows and columns from a DataFrame |
| sample() | It pulls out a random sample of rows or columns from a DataFrame |
| nsmallest() | It pulls out the rows with the smallest values in a column |
| nlargest() | It pulls out the rows with the largest values in a column |
| shape() | It returns a tuple representing the dimensionality of DataFrame |
| ndim() | It returns an 'int' representing the number of axes/ array dimensions |
| rank() | It returns values in a Series that can be ranked in order with this method |
| query() | It is an alternative string-based syntax for extracting a subset from a DataFrame |
| copy() | It creates an independent copy of pandas object |
| duplicated() | It creates a Boolean Series and uses it to extract rows that have a duplicate value |
| drop_duplicates() | It is an alternative of 'duplicated()' with the capability of removing them through filtering |
| set_index() | It sets the DataFrame index (row labels) using one or more existing columns |
| reset_index() | It resets the index of a DataFrame |
| where() | It is used to check a DataFrame for one or more condition and return the result accordingly |
Conclusion
In this article, we studied python pandas, uses of pandas in python, installing pandas, input and output using python pandas, pandas series, and pandas dataframe. Hope you were able to understand each and everything. For any doubts, please comment on your query.
In the next article, we will learn about sklearn, the next library in the series.
Congratulations!!! you have climbed your next step in becoming a successful ML engineer.
Next Article In this Series >> A Complete Python Scikit-learn Tutorial
Rijwan AnsariPosted Jan 31, 2021, 1:21 PM
Great article with many useful contents
Elavarasan RPosted Sep 17, 2019, 12:23 PM
Great. useful to me. keep sharing.