


Distributed systems are hard, and things can often get much more difficult when problems arise. This is only exacerbated by the fact that many of these systems can be notoriously difficult to dig into when they are actually out in the wild and not just running "on your machine".
They say that a picture is worth a thousand words, but in the world of distributed systems, a picture can easily be worth a thousand hours. While I can't promise you that this post will in any way save you a thousand hours, I hope that you find value in the thought process that I explored when introducing tracing and visibility into an Apache Beam pipeline.
What is Your Quest? What Do You Seek?

Before embarking on this journey, it was important to establish a few reasons why tracing is important, both in a development and production sense, as well as what the overarching goal of introducing it would be.
These are the few that I came up with,
- Improve Development Story / Observability
Developing and local testing can be challenging when working with distributed systems like Apache Beam and in particular streaming. Because of this, it can be difficult to debug and examine the data that is coming through your streaming pipeline and determine if it matches the expected outputs at various points. Additionally, the ability to trace an error to a given section of code can be invaluable.
- Provide Production Value
While you wouldn't want to actually trace every single request through your pipeline in a production environment, you could enable sampling to ensure that your production workflows are working as intended and in states where you find inconsistent results, a trace can be a valuable tool to help investigate.
- Ubiquitous Tracing
While the story itself may focus on tracing within a distributed streaming infrastructure, when done properly, it can extend outside of a streaming pipeline and provide an end-to-end tracing story from when a given element was introduced to the system and all of the actions that were performed relative to the element via the OpenTelemetry
Choose Your Own Adventure
Approaching the problem given my previous experience with Kafka and still (at the time) being relatively new to working with Beam, the following three approaches came to mind,
- The "Kafka" Approach
In Kafka, all messages that flow through the system contain a series of headers similar to those in HTTP Requests. In a tracing scenario, you would have an opportunity to inject a correlation id within the headers to persist the trace throughout the course of the pipeline. Even after a message lands within another topic, the trace would still be persisted and could be picked up further down the pipeline by simply extracting the trace from the header at any point.
- The "Wrapper" Approach
Apache Beam has no notion of headers similar to how Kafka handles storing the tracing identifier, which can make persisting the trace challenging. As a result, one approach can be to create a "wrapper" for each of the elements within your pipeline such as a TracingElement which will just wrap an existing element and contain the key-value pairs for the record as well as the tracing id. The downside of this approach is that it requires an adjustment to all of the entities and transforms throughout your system to look within the wrapper each time.
- The "Data" Approach
As mentioned in the previous point, since Apache Beam has no semblance of a ubiquitous external storage at the record level, another option is simply to add an additional property to all entities / elements within the pipeline that denotes the tracing identifier. Storing this data on the record itself will also easily allow the trace to be persisted into other technologies and will require no changes to the overall pipeline itself (as the records will be unchanged save for the property related to tracing).
After some exploration, we found that the approach with the least overhead was simply adjusting the records themselves such that each record could be responsible for persisting its own trace (aka the "Data" Approach).
The Wrapper had significant overhead with regards to coding issues after transforms and added another layer of complexity when trying to retrieve the elements to operate on. The Kafka record lent itself too heavily to Kafka and made transforming difficult, not to mention it was inefficient since it persisted information specific to Kafka throughout the process (e.g. topic names, partitions, etc.)
Take These, You’ll Need Them!

With the hopes of following open-standards like those defined by OpenTracing, I figured it best to explain a bit about what goes into a trace. These terms come up frequently when discussing tracing and frameworks that handle it, so it could hurt before we embark into the code.
- Span
A single building block representing an operation or some unit of work that you want to capture. They are capable of standing on their own, referencing (or following) from other spans, storing metadata, tags, etc.
- Trace
A trace is a visualization of the life of a request (or series of other operations) that is made up of one or more spans. This collection of spans work together to paint a picture of the overall request, allowing you to easily reconstruct what happened within each span, etc.
- SpanContext
This is a wrapper of key values pairs that associates a trace to one or more spans and is the key ingredient when carrying traces across data-boundaries (different transforms, systems, etc.). This is the primary component that we store and work with in the context of a distributed system.
Follow the Map
As mentioned earlier, a picture can say a thousand words, so it’s probably worth providing a very rudimentary example of what these pieces look like composed together, or what a timeline between actual actions and operations in the system parallel with a series of traces,
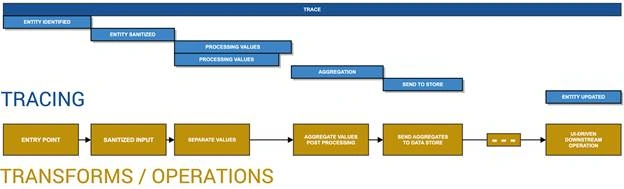
If we look at the diagram above, we can see how a given series of operations within an Apache Beam pipeline can parallel with building a trace to allow visibility into the pipeline. From the first encounter, a context will be created for the trace and spans will be associated with the context as it travels through the pipeline. It'll provide opportunities to tag searchable properties, output exceptions and logs, and much, much more.
The Adventure Begins (Using and Building a Trace)
There are four components necessary to initialize or create a trace/span within Beam, which this section will cover:
- Context
You need some type of context, which is typically just a HashMap of Key-Value pairs that is used to store the tracing information and information about the span context. This can be done in a variety of ways, but the simplest can be just to add a property for it on one of your objects.
- Tracing Configuration
If you are planning on pushing the traces to be consumed through a service such as Jaeger, you'll need to have the appropriate configuration added to your pipeline to resolve the tracer and send the traces off.
- Resolving the Tracer
Once you have the tracer configured, the next step is to resolve it within the individual element-wise transformations that are part of your pipeline. You'll need a reference (a static one) to the tracer in order to properly send off traces.
- Building a Trace
After resolving the tracer, you can easily initialize and build a trace to send off to Jaeger within your function and add the appropriate tags, logs, etc.
Defining a Context
As mentioned in the previous section, a span context can come in a variety of forms (such as a byte[], map, HTTP Headers, etc.). If you want to perform tracing at the element level, you'll want to ensure that your specific class or element has something defined to store it,
- public class TraceablePerson {
- // Other properties omitted for brevity
- // Define a publicly accessible tracing context
- public val tracingContext = mutableMapOf<String, String>()
- }
Likewise, if you were defining an Avro schema, this context might be defined as follows,
- {
- "name": "tracing_context",
- "type": {
- "type": "map",
- "values": "string"
- },
- "default": {}
- }
Configuring a Tracer
Configuring the tracer is a requirement if you want to start sending your traces to Jaeger or another service that handles distributed tracing via the OpenTracing standard.
Thankfully, it's quite easy to configure via a custom TracingOptions class that your overall Apache Beam pipeline can inherit from,
- interface TracingOptions: PipelineOptions {
- @get:Description("The tracing application name")
- @get:Default.String("your_application_name")
- var tracingApplicationName: String
- @get:Description("The tracing host name")
- @get:Default.String("localhost")
- var tracingHost: String
- @get:Description("The tracing host name")
- @get:Default.Integer(6831)
- var tracingPort: Int
- }
This will allow this configuration to be driven from command line arguments, files, or environmental variables. Next, you'll want to make sure that your overall pipeline inherits from these so they can be accessible via the pipelineOptions property within your transforms,
- // Define a pipeline configuration that is traceable and interacts with Kafka
- // (this is just an example, your mileage may vary)
- public interface YourPipelineOptions : TracingOptions, KafkaOptions {
- // Other pipeline specific configurations here
- }
Using a Tracer
After your individual elements and tracing has been configured, you are ready to build your first trace. Since tracing is done at the element-level, you'll only be able to interact with the tracer at the DoFn level within Apache Beam. As such, there are two ways to handle this, you can either explicitly initialize this during the @StartBundle operation of a given transform as seen below,
- class SomeTraceableFunction() : DoFn<KV<...>, KV<...>() {
- private lateinit var tracer: Tracer;
- @StartBundle
- fun initializeTracing(context: StartBundleContext){
- // Resolve the tracer if configured from the pipeline options
- val tracingOptions = context.pipelineOptions.`as`(TracingOptions::class.java)
- if(tracingOptions != null) {
- tracer = TracingConfiguration.getTracer(
- tracingOptions.tracingApplicationName,
- tracingOptions.tracingHost,
- tracingOptions.tracingPort
- )
- }
- else {
- // If no tracing configuration was found, use an in-memory one
- tracer = NoopTracerFactory.create()
- }
- }
- @ProcessElement
- fun processElement(@Element element: KV<...>) {
- // Omitted for brevity
- }
- }
- }
We can take a look deeper into the usage of TracingConfiguration, which is simply a wrapper class that will create our tracer using a specified configuration, which you can tailor to suit your needs,
- open class TracingConfiguration {
- companion object {
- fun getTracer(application: String, host: String, port: Int): Tracer {
- return io.jaegertracing.Configuration
- .fromEnv(application)
- .withSampler(
- io.jaegertracing.Configuration.SamplerConfiguration
- .fromEnv()
- .withType(ConstSampler.TYPE)
- .withParam(1)
- )
- .withReporter(
- io.jaegertracing.Configuration.ReporterConfiguration
- .fromEnv()
- .withLogSpans(true)
- .withFlushInterval(1000)
- .withMaxQueueSize(10000)
- .withSender(
- io.jaegertracing.Configuration.SenderConfiguration
- .fromEnv()
- .withAgentHost(host)
- .withAgentPort(port)
- )
- )
- .tracer
- }
- }
- }
This static reference will allow you access to the tracer which will be used to build your traces and send them to Jaeger (or not do anything if you haven't configured it). If you plan on doing any decent amount of tracing, you'll likely find it beneficial to constructor your own TraceableDoFn to handle this,
- public lateinit var tracer: Tracer;
- @StartBundle
- fun initializeTracing(context: StartBundleContext) {
- // Resolve the appropriate tracer if configured
- val tracingOptions = context.pipelineOptions.`as`(TracingOptions::class.java)
- if (tracingOptions != null) {
- tracer = TracingConfiguration.getTracer(
- tracingOptions.tracingApplicationName,
- tracingOptions.tracingHost,
- tracingOptions.tracingPort
- )
- } else {
- tracer = NoopTracerFactory.create()
- }
- }
This will allow you a publicly accessible tracer instance within any usages of the TraceableDoFn, which will cover using in the next section.
Constructing a Trace
As we discussed earlier in this post, we would be adopting an element-wise tracing context that could follow each individual message as it flowed through the pipeline:
- public val tracingContext = mutableMapOf<String, String>()
Now, sometimes creating a trace can be somewhat involved, but might typically look like this,
- fun trace(context: MutableMap<String, String>, name: String, tracer: Tracer){
- // Create a builder for this span
- val spanBuilder = tracer.buildSpan(name)
- // If we have some type of previous context, we need this to associate them
- if (context.isNotEmpty()) {
- // If so, indicate this is a continuation from the previous context
- val existingSpan = tracer.extract(TEXT_MAP, TracingContextExtractor(context))
- spanBuilder.addReference(References.FOLLOWS_FROM, existingSpan)
- }
- // Start the context
- val span = spanBuilder.start()
- try {
- // Activate this span and update the context
- tracer.scopeManager().activate(span)
- tracer.inject(span.context(), TEXT_MAP, TracingContextInjector(context))
- // Add tracing information here
- span
- .setTag("some-tag", "some-value")
- .log("log some message")
- } catch (ex: Exception) {
- Tags.ERROR.set(span, true)
- span.log("$ex");
- } finally {
- span.finish()
- }
- }
As you might imagine, that can be a lot, so we can create some extension methods to handle simplifying this into two functions: one to initialize a trace and another to diverge an existing trace,
- // Initializes a new trace/span
- fun Tracer.trace(context: MutableMap<String, String>, name: String, traceFunction: (span: Span) -> Unit) {
- // Create a builder for this span
- val spanBuilder = this.buildSpan(name)
- // If we have some type of previous context, we need this to associate them
- if (context.isNotEmpty()) {
- // If so, indicate this is a continuation from the previous context
- val existingSpan = this.extract(TEXT_MAP, TracingContextExtractor(context))
- spanBuilder.addReference(References.FOLLOWS_FROM, existingSpan)
- }
- // Start the context
- val span = spanBuilder.start()
- try {
- // Activate this span and update the context
- this@trace.scopeManager().activate(span)
- this@trace.inject(span.context(), TEXT_MAP, TracingContextInjector(context))
- // Apply any internal tracing
- traceFunction(span)
- } catch (ex: Exception) {
- Tags.ERROR.set(span, true)
- span.log("$ex");
- } finally {
- span.finish()
- }
- }
- // Creates a new span that follows from an existing one
- fun Tracer.follows(
- context: MutableMap<String, String>,
- name: String,
- traceFunction: (span: Span) -> Unit
- ): MutableMap<String, String> {
- // Create a copy of the context if one exists
- val contextualCopy = HashMap(context)
- // Create a builder for this span
- val spanBuilder = this.buildSpan(name)
- // If we have some type of previous context, we need this to associate them
- if (context.isNotEmpty()) {
- // If so, indicate this is a continuation from the previous context
- val existingSpan = this.extract(TEXT_MAP, TracingContextExtractor(context))
- spanBuilder.addReference(References.FOLLOWS_FROM, existingSpan)
- }
- // Start the context
- val span = spanBuilder.start()
- try {
- // Activate this span and update the context
- this@follows.scopeManager().activate(span)
- this@follows.inject(span.context(), TEXT_MAP, TracingContextInjector(contextualCopy))
- // Apply any internal tracing
- traceFunction(span)
- } catch (ex: Exception) {
- Tags.ERROR.set(span, true)
- span.log("$ex");
- } finally {
- span.finish()
- }
- // If we are not explicitly overwriting, we want to be
- // able to capture the underlying context
- return contextualCopy
- }
After you've established your tracer within your appropriate element-wise transform, you can use the trace() method to build and start your trace as seen below leveraging those extension methods,
- fun processElement(@Element element: KV<...>) {
- // Omitted for brevity
- // Create a span (which will create a new trace behind the scenes)
- // that applies contextually to this specific element (via tracingContext)
- tracer.trace(element.tracingContext, "name_of_span") { span ->
- // In here you can perform any operations that you might care about
- // and use the span reference to add tagging, logging, etc. as seen
- // below
- span
- .setTag("some_property", element.someProperty)
- .log("Log some message about the element here")
- }
- }
- The element context is examined to determine if any previous spans exist.
- If a span did exist, a FOLLOWS_FROM attribute is added in order to relate this operation to the chain of other potential spans for this element.
- If a span did not exist, a new span is generated and injected into the context.
- The trace() call itself is finalized at the close of the closing bracket, which disposes of the span and it is finalized/committed to the appropriate tracer.
- Any errors within the body of the trace() function will be properly decorated as errors and the log within the span/trace will contain the complete stack trace for the error.
- Upon the finalization of a trace, it is committed to Jaeger (or your preferred/configured tracing system) and it should appear within the UI for those tools. This is performed within the trace() call automatically, so you don't need to worry about it yourself.
Support for Divergent Traces
Pipelines are seldom linear. Complex ones frequently branch, diverge and split off onto multiple paths, therefore tracing needs to support such operations and thankfully we can.
Let's consider you had a single event that was coming into your system and it had some notion of being traced. As we saw in the earlier example, we could easily do this via the trace() we showed off in the previous step,
- // Start a trace for your event
- tracer.trace(event.tracingContext, "name_of_span") { ... }
This will establish your trace and expose it up to Jaeger, Google Operations (formerly StackDriver), or your preferred OpenTracing consumer. However, if during your pipeline, you wanted to trace other entities that branch off from your event (e.g. an event contains multiple user instances that we care about, so we want to initialize traces from those that follow from our event).
To accomplish this, you can use the follows() API to create a new trace that follows from an existing one. What this means is that you can have an element traced independently downstream, but ultimately it can still be linked back to the originating record that introduced it into the system,
- // Initialize the trace for a new traceable instance from an existing context
- user.tracingContext = tracer.follows(event.tracingContext, "found_user") { ... }
After introducing this into your pipeline and running some data through, you can view the trace (covered in the next section) to visualize this branching within the trace,
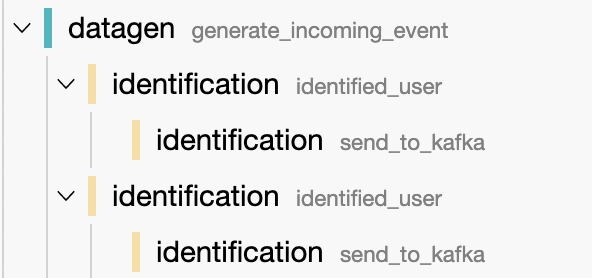
What you can see in this chart is the following steps,
- An event was introduced into the system and its trace was initialized.
- Within the identification Apache Beam pipeline, two separate users were identified from this event with their own independent tracing contexts.
- Downstream each of these users were sent to Kafka topics with appropriate tracing during that process (this step having no notion of the existence of an event itself)
As you might imagine, an entirely separate Apache Beam pipeline could pick up one of these users, and apply an additional trace, which will ultimately appear on the overall graph for the originating event.
Accessing Your Trace
NOTE
This assumes that either have a production instance of Jaeger running or a local instance (perhaps inside of a Docker container) where you can send your traces.
Once you've updated your applications to configure a tracer, your elements to contain and support contextual tracing, and actually run them, you are ready to leave your application and take a look at the traces themselves in Jaeger.
After running your application, you should be able to visit your Jaeger instance, which provide a UI to visualize the traces themselves,
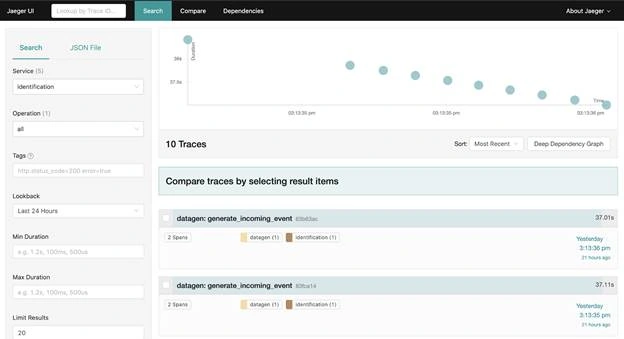
From the Jaeger UI, you can do quite a bit in terms of exploration. You get an overview of all of the applications that are currently performing traces and filter down by a specific application. You can also search all of the known spans for a given tag that was defined within your application (e.g. a search for error=true would display every span that contained an error, so you could easily find errors within your pipeline).
Additionally, you can drill into any given trace to see more information about it such as timings, individual tags, logging information and more,
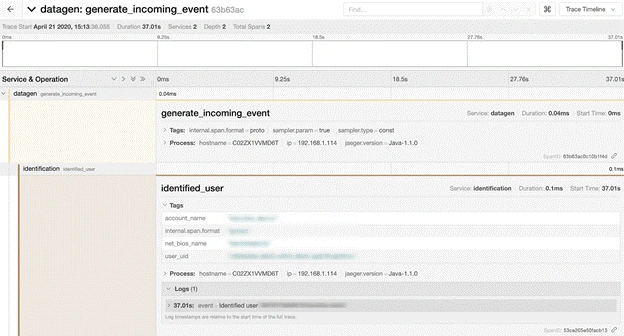
While this example is a very simple use case, you can imagine the value in more complex systems, especially during the development process, for logging aggregations in real-time, ensuring that transformations are being performed correctly, etc. The UI also provides a graphical representation of a trace as well,
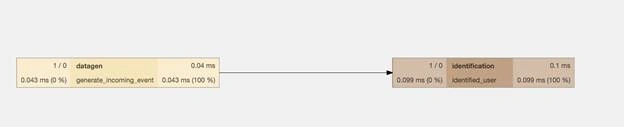
You can also take two traces and compare them against each other to see where one might diverge (e.g. if one contained erroneous data it might be offloaded to a Kafka topic for manual review and another would continue on to its expected destination). As you might imagine, adding more traces, spans, and applications, this image would begin to expand into a complete graph of your entire system.
The End?
Obviously tracing and logging are their own massive topics that entire books have been dedicated to, so this is really just the tip of the iceberg. This post just covered the most simple of use cases for getting started with a tracing framework in a distributed system. There's a wide range of different frameworks, implementations, and strategies but this was just one of the options that was chosen.
Join the conversation! Your thoughts help the community grow.