
The original code came from Scott Guthrie's chart engine example. The differences from original code are:
- Some of chart's attributes are exposed as
properties.
- ChartGenerator.ChartLine.Color
- ChartGenerator.ChartLine.Style
- ChartGenerator.ChartLine.Width
- The above are used for setting the properties of
each line from chart.
- ChartGenerator.Engine.ImageBackgroundColor
- ChartGenerator.Engine.ImageHeight
- ChartGenerator.Engine.ImageWidth
- ChartGenerator.Engine.IsScaled - determines when the chart will be scaled or not.
- The minimum and maximum points are calculated
inside using Array methods. We copied the Y values of each line into an
array, sorted the array and using the first and the last member of array
determined the maximum and the minimum.
Testing code:
.....
Imports
ChartEngine.ChartGenerator
.....
'initing the chart's data
Dim
myChartData As
New ChartData
Dim
XValues As
Long() = {1, 2, 3, 4, 5, 6, 7, 8, 9}
myChartData.XValues = XValues
'line 1
Dim
Line1 As
New ChartLine
Dim
YValues1 As
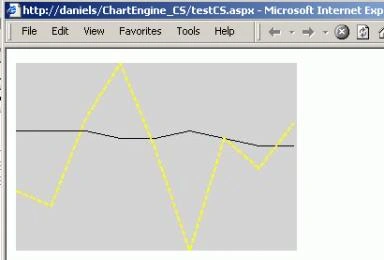
Long() = {1280, 1280, 1280, 1270, 1270, 1280, 1270, 1260, 1260}
Line1.ChartLine.LinesValues = YValues1
myChartData.Lines.Add(Line1)
'line 2
Dim
Line2 As
New ChartLine
Dim
YValues2 As
Long() = {1200, 1180, 1296, 1370, 1257, 1120, 1270, 1230, 1290}
Line2.ChartLine.LinesValues = YValues2
Line2.Color = Color.Yellow
Line2.Width = 2
Line2.Style = Drawing.Drawing2D.DashStyle.Dash
myChartData.Lines.Add(Line2)
'calling the engine
Dim
oEngine As
New ChartEngine.ChartGenerator.Engine
oEngine.ImageHeight = 200
oEngine.ImageWidth = 300
oEngine.IsScaled = True
oEngine.ImageBackgroundColor =
color.LightGray
' Render BitMap Stream
Back To Client
Dim
StockBitMap As Bitmap =
oEngine.DrawChart(myChartData)
StockBitMap.Save(Response.OutputStream, ImageFormat.JPEG)
.....
and the testing code for C# version of engine:
Join the conversation! Your thoughts help the community grow.