

The bar chart control renders a barchart with multiple series of values. This control is compatible with any browser which supports SVG. The control has four type of bar charts namely Column, StackedColumn, Bar and StackedBar.
Let’s see its initial configuration in a page with code and its output.
- <ajaxToolkit:BarChart ID="BarChart1" runat="server" ChartHeight="300" ChartWidth="450" ChartType="Column" ChartTitle="United States versus European Widget Production" CategoriesAxis="2007,2008,2009,2010,2011,2012" ChartTitleColor="#0E426C" CategoryAxisLineColor="#D08AD9" ValueAxisLineColor="#D08AD9" BaseLineColor="#A156AB">
- <Series>
- <ajaxToolkit:BarChartSeries Name="United States" BarColor="#6C1E83" Data="110, 189, 255, 95, 107, 140" />
- <ajaxToolkit:BarChartSeries Name="Europe" BarColor="#D08AD9" Data="49, 77, 95, 68, 70, 79" />
- </Series>
- </ajaxToolkit:BarChart>

BarChart Properties
- ChartHeight
This property enables you to customize the height of the chart.
ChartHeight="600"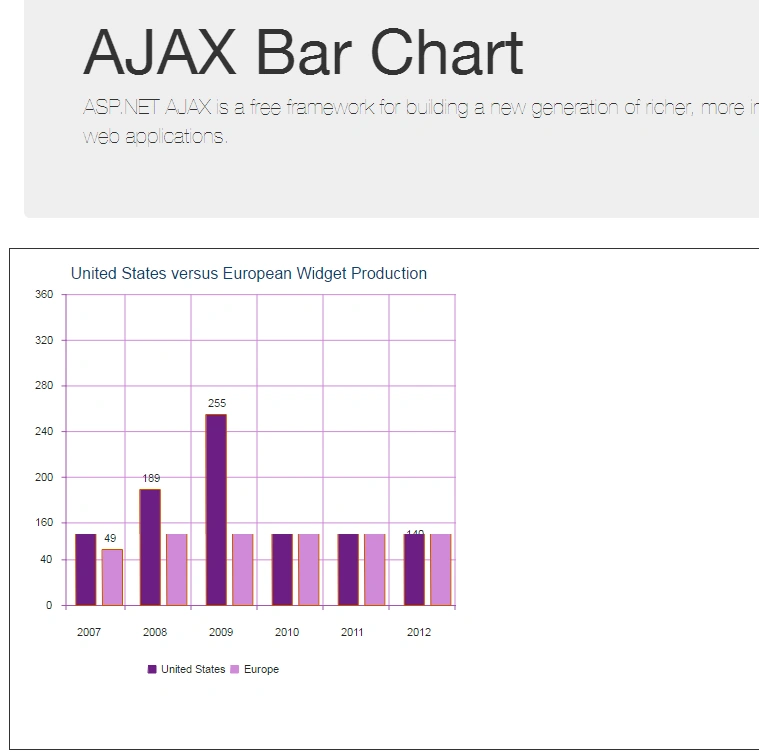
- ChartWidth
This property enables you to customize the width of the chart.
ChartWidth="750"
- ChartTitle
This property enables you to set the title of the chart.
ChartTitle="United States versus European Widget Production"
- CategoryAxis
This is a required property. You need to provide a set of values for the category axis to create a bar chart.
CategoriesAxis="2007,2008,2009,2010,2011,2012"
- ChartType
This property enables you to render different types of bar charts including Column, StackedColumn, Bar, and StackedBar.

Column
Bar

Stacked Bar
Stacked Column
- Theme
This property enables you to control the appearance of the bar chart with a Cascading Style Sheet file.
- ValueAxisLines
This property enables you to set the interval size for the value axis line.
ValueAxisLines="3"
- ChartTitleColor
This property enables you to set the font color of the chart title.
ChartTitleColor="Green"
- CategoryAxisLineColor
This property enables you to set the color of the category axis lines.
CategoryAxisLineColor="Green"
- ValueAxisLineColor
This property enables you to set the the color of the value axis lines.
ValueAxisLineColor="Red"
- BaseLineColor
This property enables you to set the color of the base lines of the chart.
BaseLineColor="Blue"

BarChartSeries Properties
- <Series>
- <ajaxToolkit:BarChartSeries Name="United States" BarColor="#6C1E83" Data="110, 189, 255, 95, 107, 140" />
- <ajaxToolkit:BarChartSeries Name="Europe" BarColor="#D08AD9" Data="49, 77, 95, 68, 70, 79" />
- </Series>
- Name
This property is required.
Name="United States"
- Data
This property is required and provides data for a particular series.
Data="110, 189, 255, 95, 107, 140"
- BarColor
This property enables you to set the color of bar for a particular series.
BarColor="#6C1E83"
RAMESH RAMPosted Apr 19, 2018, 12:18 AM
How to add mean average line in ajax bar chart?
Iqrar AliPosted Dec 9, 2016, 9:43 AM
Very knowledgeable piece of data.
Vignesh ManiPosted Jun 28, 2016, 8:30 AM
Good one