
Introduction
When you start a software project, you don't always have optimization in mind.
It may not be until the very end of the project that you realize your
application is running too slow, or the application does not fit your customer's
expectations with speed and responsiveness. It is at this point that you want to
find a good profiling tool. Personally, I like a profiling tool in which I don't
have to think too much. I want a profiler that will just install and after
running my application, give me the results in a simple table format. The
ANTS Performance Profiler is just such a
tool.
Installation
Installation of the ANTS Profiler was relatively painless. Because the Profile
supports profiling all the way back to Visual Studio 2005, the tool installs for
all of these platforms. Personally, I'm good from 2008 to 2010, but I'm sure
there are a few legacy apps out there which are still built on the older
platform. ANTS installs directly into the menu structure of Visual Studio as
shown in Figure 2. You also get the added bonus of .NET Reflector, which is an
invaluable tool to the .NET developer. .NET Reflector (for those who have never
used it before) can reflect through any .NET assembly to give you the underlying
C# code. You can even use .NET Reflector to view Microsoft System .NET
assemblies and see what they are doing under the covers.
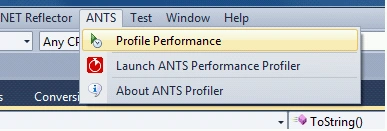
Figure 2 - ANTS integration into Visual Studio
Using the Tool
I decided a fun thing to profile would be one of my articles on genetic
algorithms, since these algorithms are so calculation intensive. I'm always
interested on how I might improve them and make them faster since they seem to
run for a long time.
Figure 3 shows an
article I wrote on using the compact genetic algorithm to calculate roots.
In the application, you enter a number and the root you want to compute (e.g.
square root), and the compact genetic algorithm will run through a few thousand
generations to figure out the closest root.
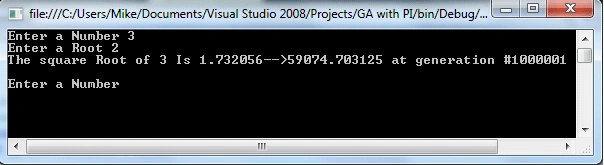
Figure 3 - Compact GA Algorithm for computing roots
Profiling the Application with ANTS
Profiling the application with ANTS Profiler is a snap. Simply open your
solution in visual studio, and choose Profile Performance from the ANTS menu
integrated in Studio. This will bring up the Peformance Analysis Window shown in
figure 4 as well as launch your application.
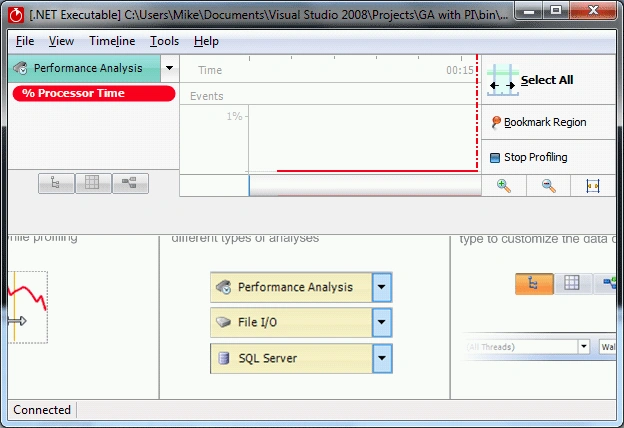
Figure 4 - Performance Analysis Window in the ANTS Profiler
After the results come back from the GA algorithm, you can simply hit Stop
Profiling and you are done collecting information. That's it. No fuss, no muss,
and hardly any thinking. You don't need any knowledge of generated files and
their extensions or command line arguments, you just get the results shown in
figure 6.
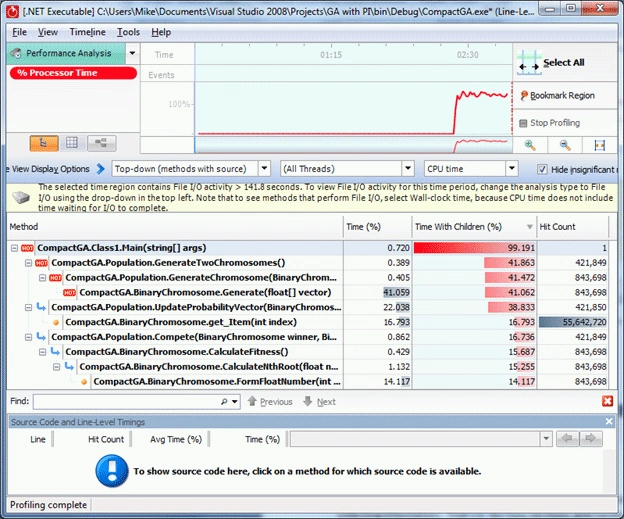
Figure 5 - Results of profiling the Compact GA for Discovering Roots
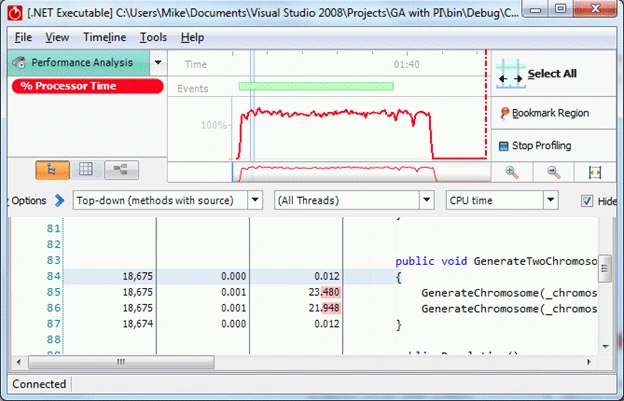
Inside this window you can drill down into your heavily intensive cpu regions
and see exactly in the code where we are spending our time. If we drill down
into where the code is spending most of the percentage of its time (Figure 7),
we see that it uses up half of its time generating chromosomes. This is to be
expected, since each generation is generating 1000 chromosomes. That's a lot of
random number generation!
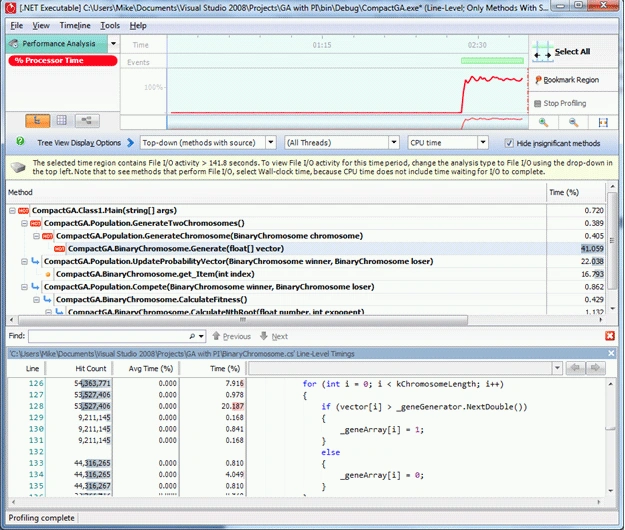
Figure 6 - Drilling Down into the time intensive line of code
We might start to think of ways to reduce this time by generating the gene
arrays using more optimal means
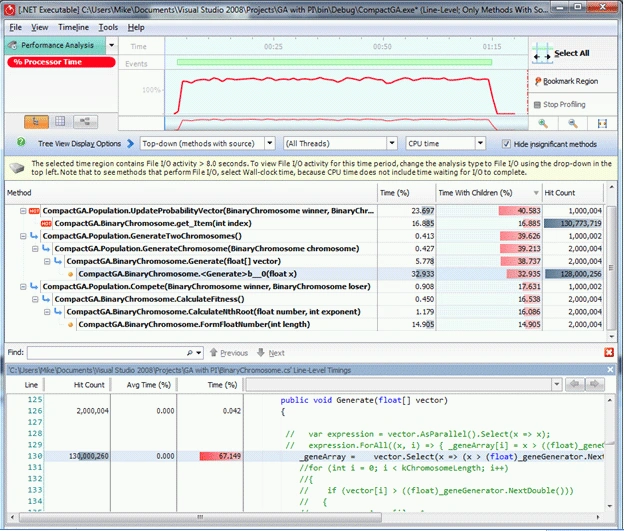
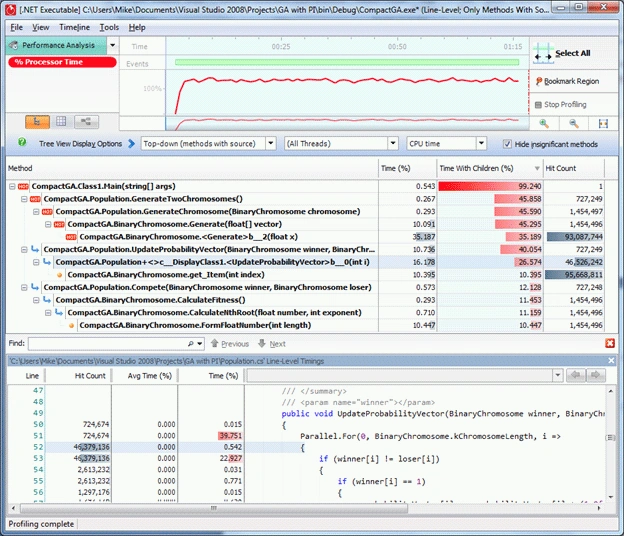
Let's use a regular Linq expression to see if we get any improvement
Listing 1 - Using Linq to generate the Gene Array in the Compact GA
_geneArray = vector.Select(x => (x > (float)_geneGenerator.NextDouble())
? 1 : 0).ToArray();

Join the conversation! Your thoughts help the community grow.