

Introduction
Microsoft Fabric lets you create reusable and default Power BI semantic models to create reports in various ways in Power BI. This article describes how to create automatic reports through the semantic data model and you will also learn how to change the visuals created automatically.
Detailed steps to follow
Step 1. Launch Fabric and Select Power BI
Step 2. Select the workspace
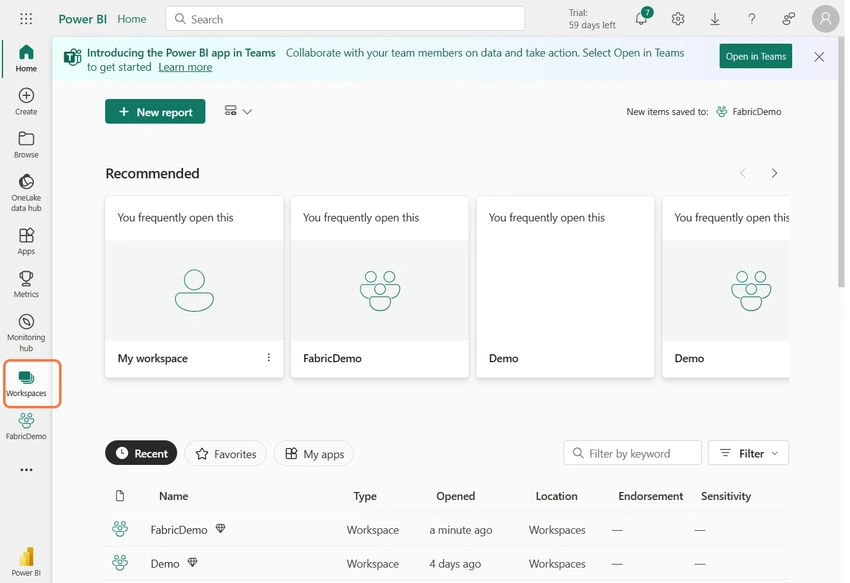
Step 3. Select the appropriate workspace

Step 4. Select New
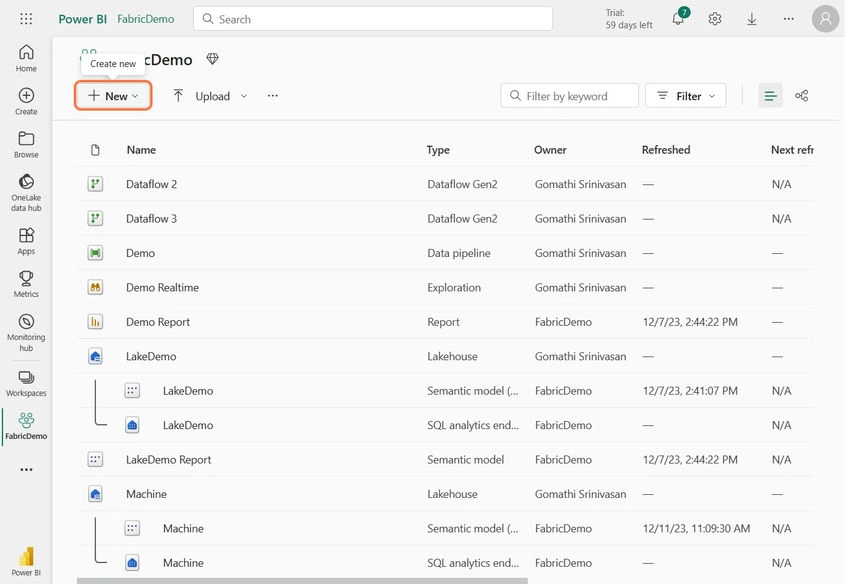
Step 5. Select Report

Step 6. Select "Pick a Published Data model"

Step 7. Select the Appropriate data hub

Step 8. Click "Autocreate"

Step 9. See the automatically created Report

To change the designed chart to a different Visual
Step 1. Click "Edit"

Step 2. Click "Continue"

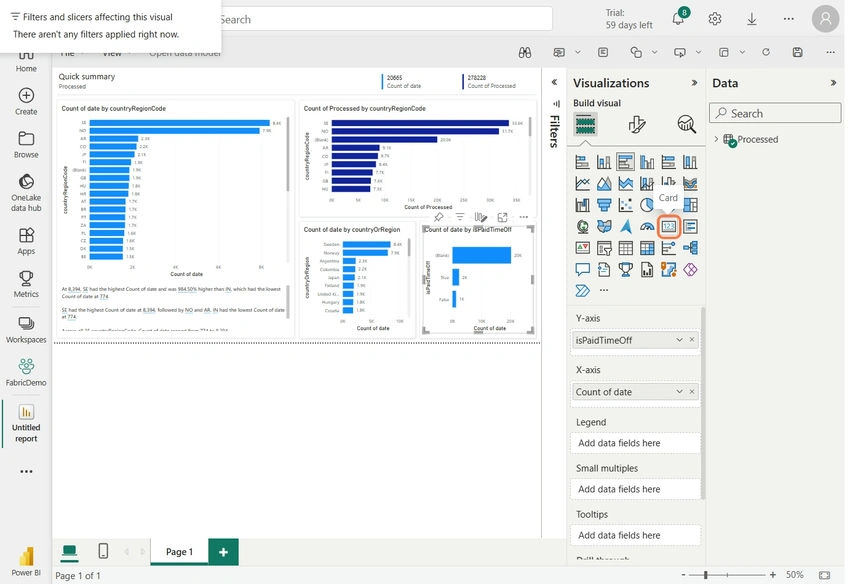
Step 3. Click any visual that you want to change. In my example, I have selected "Count of date by IsPaidTimeOff"

Step 4. Select the visual to change from the Visualization pane. I have selected "Card" visual.
.
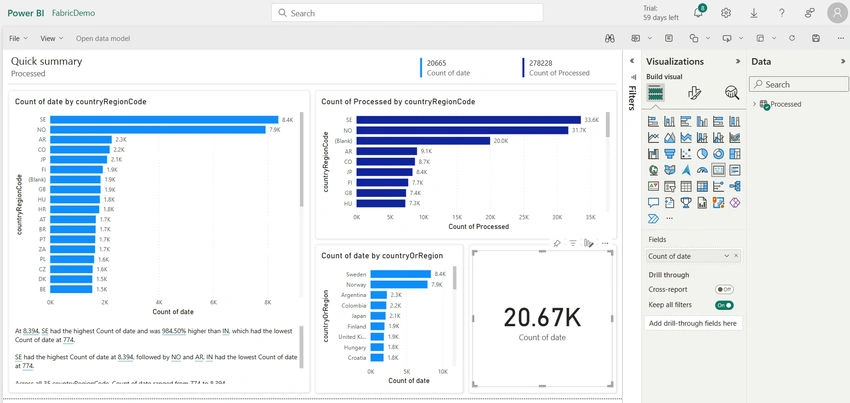
Step 5. Now, you can see the changed visual
Conclusion
Finally, we created a Power BI report from the Data hub within a few seconds and learned how to change the visual based on the need.
Join the conversation! Your thoughts help the community grow.