

In this article, I will walk you through how to use Power BI Desktop to connect, analyze, and visualize data that is stored in a storage account that has a hierarchical namespace (Azure Data Lake Storage Gen2). Let's get started
In the screenshot below, we have got sales2015 to sales2018 CSV files that is already loaded to the salesdata container of the cornerstoneanalytics storage account.
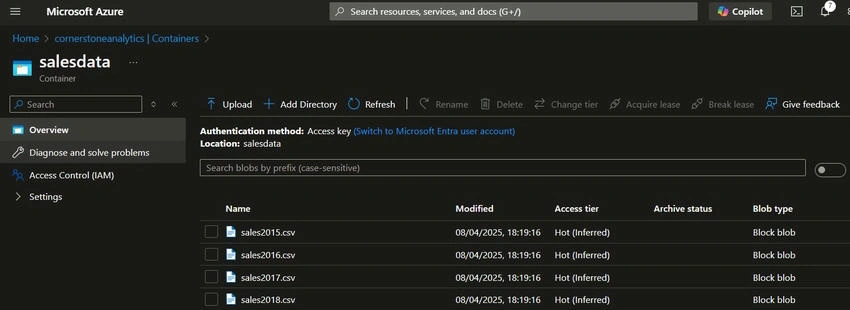
To successfully connect to the CSV files in the container, we must ensure that the user who intends to use Power BI Desktop to connect is granted one of the following roles for the storage account: Blob Data Reader, Blob Data Contributor, or Blob Data Owner
To grant the permission.
- In the storage account, select Access Control(IAM)
- Click Add Role Assignment
- Search and select for Storage Blob Data Contributor, as seen below
- Click Next
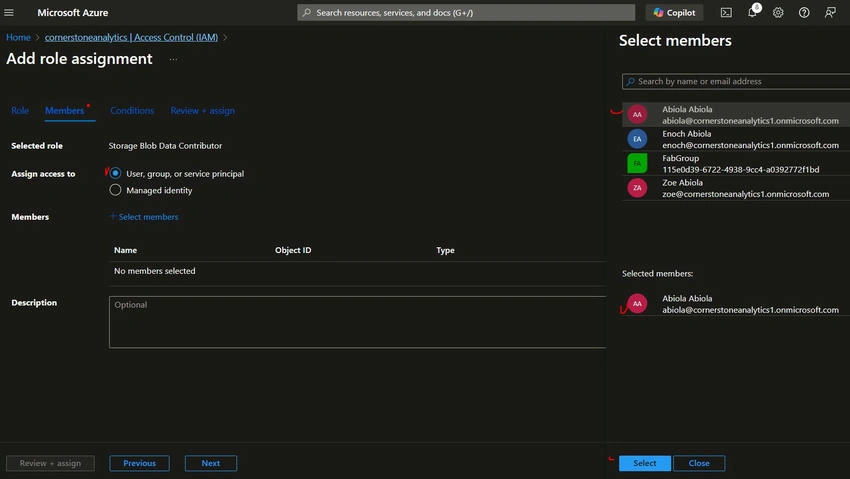
- Click Select members
- Select the user to assign the permission to on the right-hand side. In this case, I selected my Entra ID abiola
- At the bottom-right-click on Select.
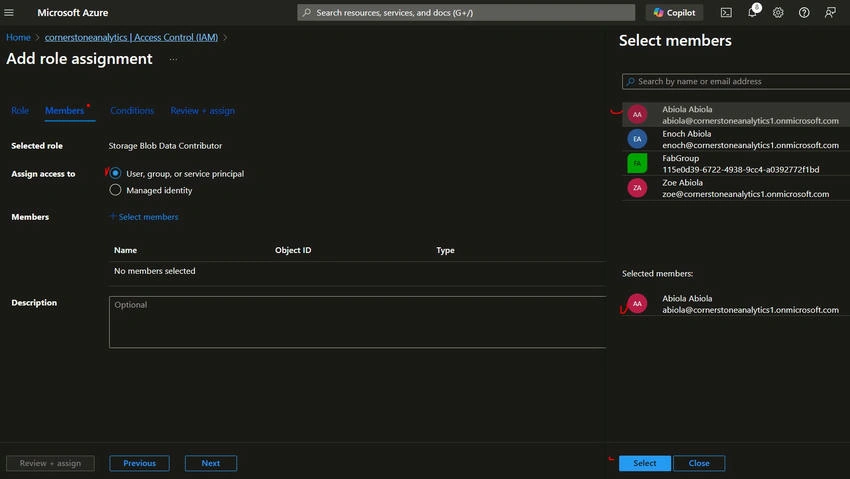
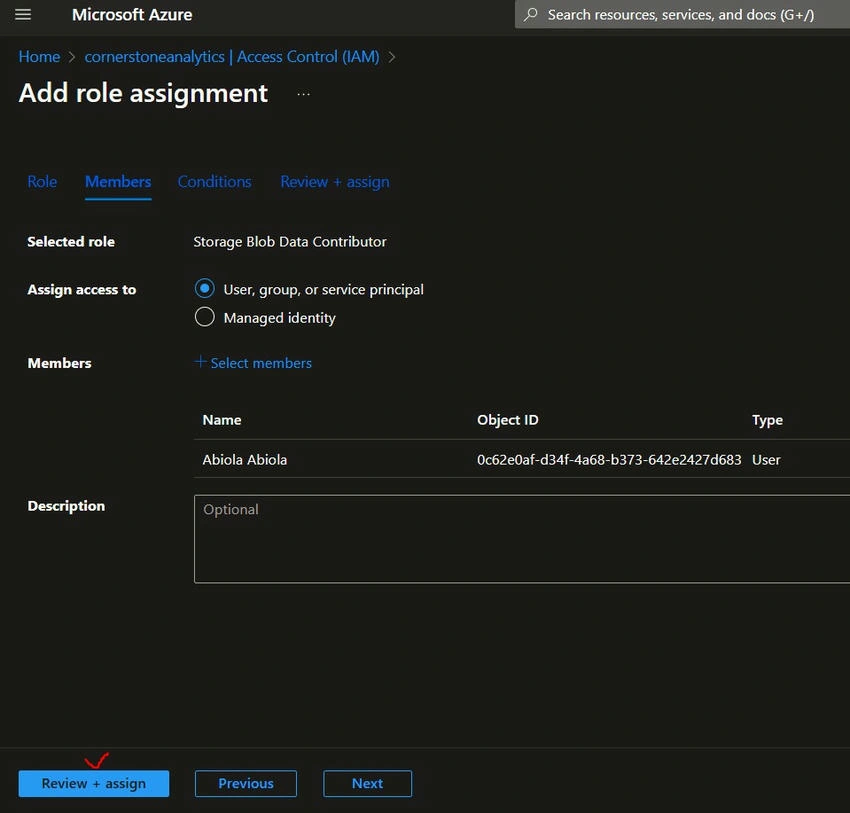
- Click on Review + assign twice.
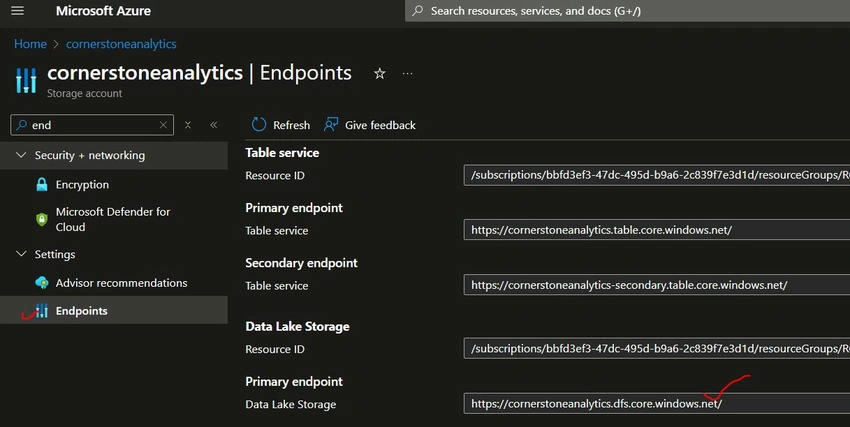
- After granting the required permission, we need to fetch the Data Lake Storage primary endpoint URL we need in Power BI. To get that.
- In the storage account, search box, search for Endpoint and select it.
- Scroll down and locate Data Lake Storage. Copy the Primary endpoint URL.
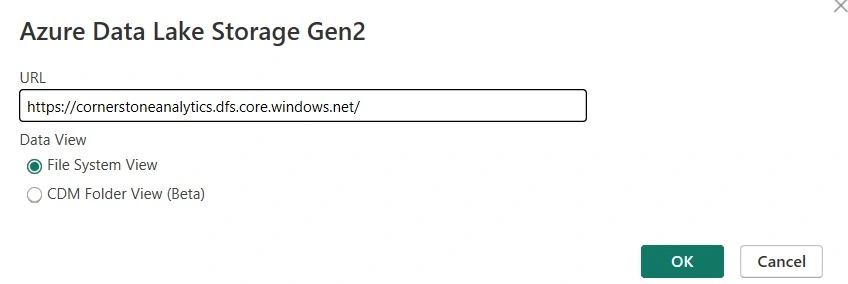
- Open Power BI Desktop and click on Get Data and More option
- Search for Azure Data Lake Storage Gen2 and paste the URL as seen below
- Click OK.
- If you are doing this for the first time, you will be asked to use an Organizational Account, Account Key, or Shared Access Signature to connect.
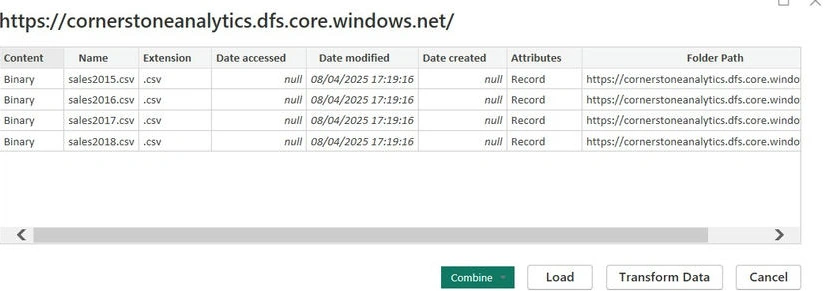
- Voila! We can we all the sales2015 to sales2018 csv files. This means we have successfully connected to the storage account.
- Select Combine and Transform. This would combine all the files as a flat table.
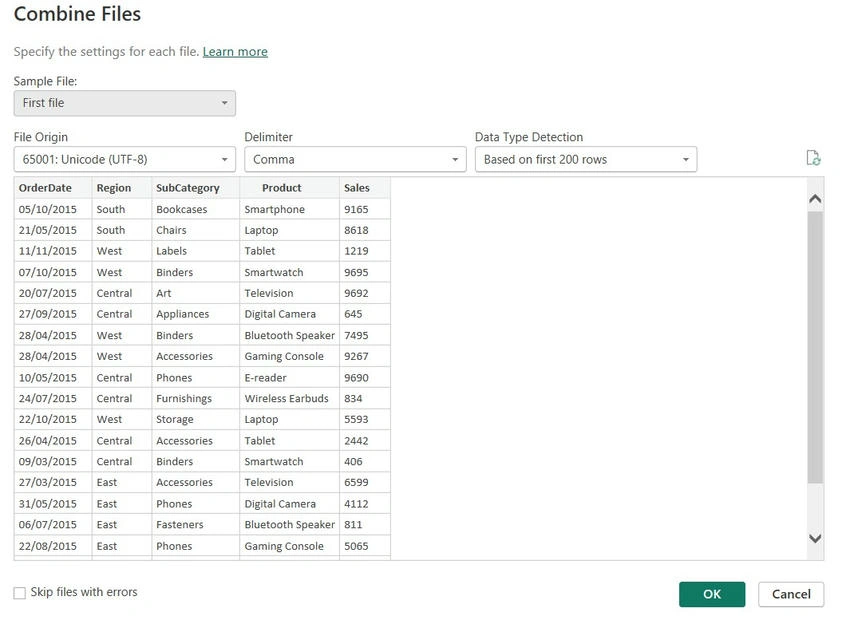
- In the intermediate step, we can see the first file sample of the data. Once happy, click OK. This would launch the data in the Power Query editor.
- There we go! The data is now visible in the Power Query editor, as seen below.
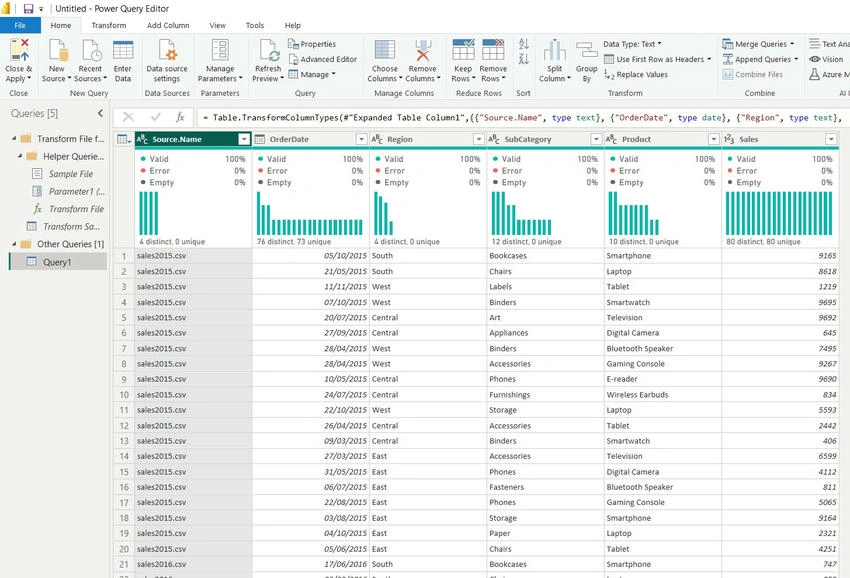
The first column is removed and I have added a new column by extracting the Year from the OrderDate column. So, in the Home tab of the Power Query, click on Close and Apply.
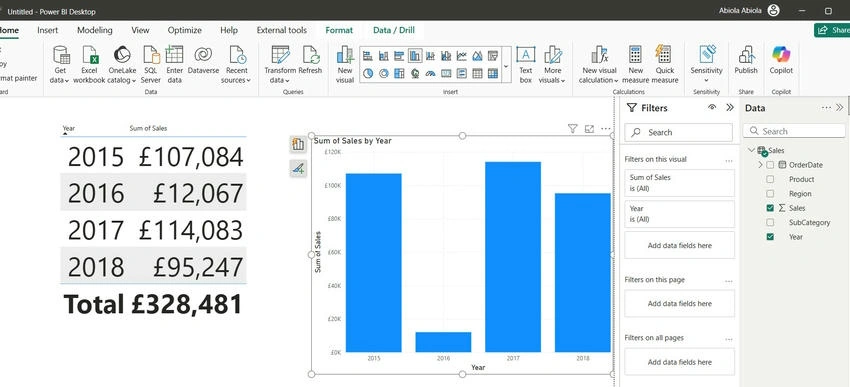
We can build a report on the data. We visualize Sales by Year using a table and clustered column chart as seen below.
Join the conversation! Your thoughts help the community grow.