

Introduction
I had a small experiment to prove the point under discussion. I have a table named accounts in SQL Server database and I added 20,000 rows into the table with 9 columns and approximately 1 Kilobyte of data per record. After loading into my Business layer, I am converting it back to a DTO and returning to my web service. Just to test the performance, I added two performance counters - one for “for each” loop and one for “for loop”. The results are obvious. The foreach loop took 107 milliseconds to execute the same process while the classic for loop took 14 milliseconds.
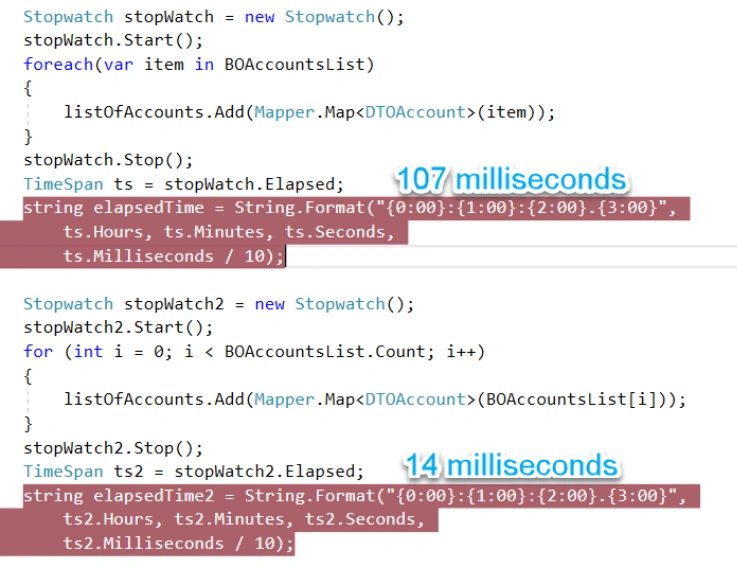
Now, why does this happen? Let's go a bit deeper.
For Loop Vs. Foreach Loop
The for loop version uses enough stack space for only two local variables (counter and i). The Foreach version, on the other hand, uses stack space for four locals (item, AccountList object, and two compiler-generated temporaries).
When a method is called in the CLR, all of the memory required for the locals is allocated upon the stack. As this takes place on the stack, this process is fast but it is not free. That is why the foreach-loop will incur a small cost due to its extra two local variables.
There is something else which changes the effect.
If we use the local variable multiple times in the for loop and foreach loop, see what happens.
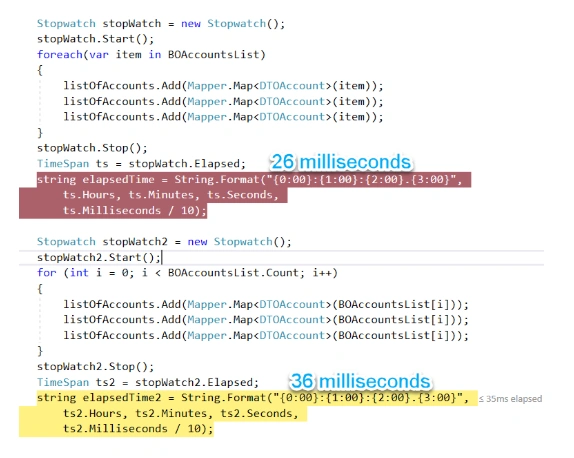
The game is reversed. If we have to access the local variable value multiple times in the for loop, in that case, the performance will decrease.
Summary
- This foreach loop is faster because the local variable that stores the value of the element in the array is faster to access than an element in the array.
- The forloop is faster than the foreach loop if the array must only be accessed once per iteration.
Khang VoPosted Jul 22, 2021, 10:53 AM
Hi Ali Sufyan when I changed position between For and Foreach, the result is a difference
Gökhan AtilganPosted Jan 15, 2020, 11:36 AM
I tested one .net core mvc project on like this comparison in the View. Result : 1000 data binding finish to for loop 8seconds and foreach loop 3 seconds.
Ali SufyanPosted Dec 10, 2019, 4:56 AM
Well Julian, Again its not a matter of what Automapper does or not, forget about Automapper, and do some database operation inside the loops, or some thing else, its the internals of for and foreach loop, how they are handled in memory that makes the difference.
Julian HanssenPosted Sep 5, 2019, 2:45 AM
As others are saying, these numbers make no sense. And I'm pretty sure you are taking a one time Automapper setup hit in the first Mapper.Map() in the first foreach. Automapper probably initializes all maps on first access. Try doing a Mapper.Map() first before executing and timing any of the foreach/for and rerun your tests.
James CurranPosted Aug 8, 2019, 2:16 PM
I didn't mean to suggest that you made up the numbers. Sorry if that's how you read it. I'm sure you reported the times accurately --- I was trying to say that since the numbers don't make sense, there must be some external force (one-time setup, JIT-ing, etc) which is affecting the times.
James CurranPosted Aug 7, 2019, 10:14 AM
Your results really don't make any sense at all. Going from the first set to the second set, your triple to work done. With the for(), the time approx. triples, -- that's fine. But when you do the same thing with the foreach().... the time drops to a quarter?? Clearly something is wrong with your calculations -- particularly the first foreach(). I haven't looked at the IL code for these, but allocations on the stack, regardless of space, should all just a single subtraction. That's not going to be the difference you are seeing. What I think is actually cause the difference are things unreleated to the loop structure: a) Mapper.Map() is probably doing a lot of reflection the first time it is called, and than caching the results, so the first call get a tremendous time hit, and the others are fast. In fact, that first call might be trigger teh JIT compile on the Map() code. b) the Add() of listOfAccounts, causes the list to grow, which triggers reallocations. A List<> starts small, and each time it fills, it reallocated to double in size, which means that in th eforeach() loop, it reallocated several times, but during the for() loop, it reallocated at most once. Regardless of all of that, you are doing so much work inside the loop, the time for the actual loop structure itself would just be lost in the noise. I'd suggest using a much simplier body for the loop (call an empty function passing the value as a parameter), and use benchmarkdotnet (https://benchmarkdotnet.org/) to handle the timings.
James CurranPosted Aug 7, 2019, 9:55 AM
Your results really don't make any sense at all.