

Introduction
In this article, I will show you Chart Helper in the ASP.NET Web API, including the use of Chart Helper for creating charts. The Chart Helper is used for showing data in graphical form. Here I describe how to create a chart in the ASP.NET Web API.
The methods used in Chart Helper are:
- Addtitle: This method adds the tile to the chart.
- Addseries: It is used for providing data points and series of attributes for the chart.
- SetXAxis: It sets the value for the horizontal axis (X-Axis).
- SetYAxis: It sets the value for the vertical axis (Y-Axis).
- Save: By using this method we can save the chart image to the specified file.
- SaveToCache: It saves the chart image in the system cache.
We use the "Chart" constructor that creates a new instance. The namespace is "System.web.Helpers".
Now the procedure for creating the chart.
Step 1
Create a Web API project.
- Start Visual Studio 2012.
-
From the start window select "New Project".
-
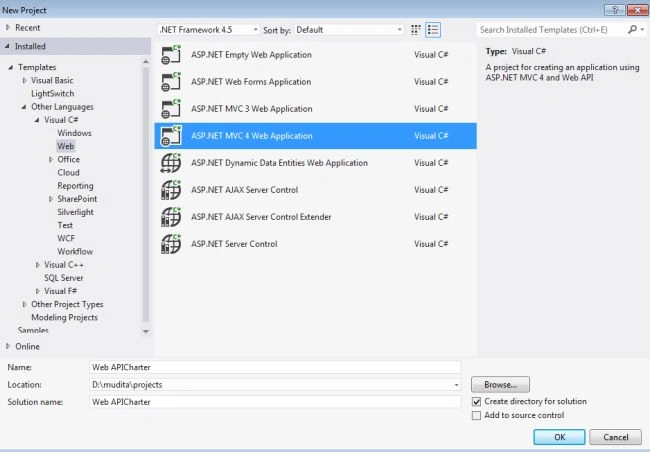
In the Template Window select "Installed" -> "Visual C#" -> "Web".
-
Select "ASP.NET MVC 4 Web Application" and click on "OK"
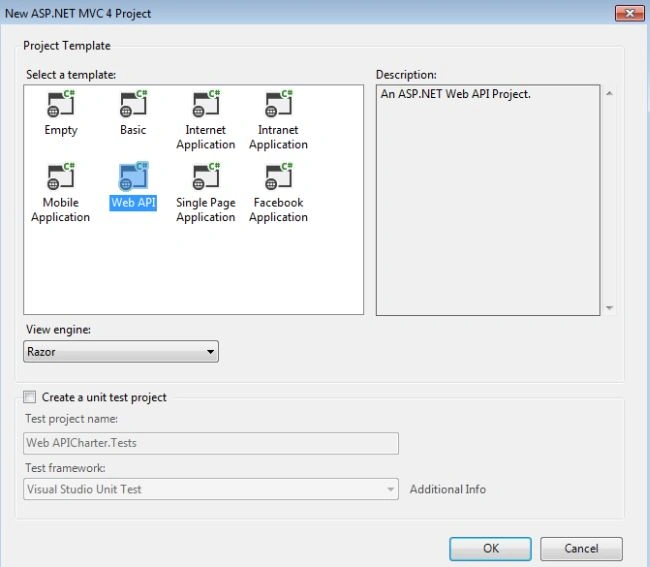
- From the "MVC4 Project" window select "Web API".
Step 2
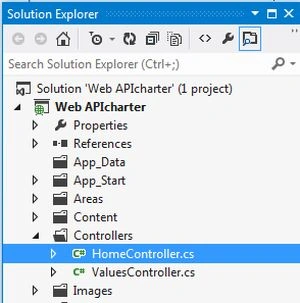
Open the "HomeController" file. This file exists in:
- In the "Solution Explorer".
- Select "Controller folder"->"HomeController".
Add this code:
- using System;
- using System.Collections.Generic;
- using System.Linq;
- using System.Web;
- using System.Web.Mvc;
- using System.Web.Helpers;
- namespace Web_APIcharter.Controllers
- {
- public class HomeController : Controller
- {
- public ActionResult Index()
- {
- return View();
- }
- public ActionResult CharterHelp()
- {
- new Chart(width: 500, height: 300)
- .AddTitle("Chart for languages")
- .AddSeries (chartType: "column",
- xValue: new[] { "ASP.NET", "HTML5", "C Language","C++" },
- yValues: new[] { "90", "100", "80", "70" })
- .Write("bmp");
- return null;
- }
- }
- }
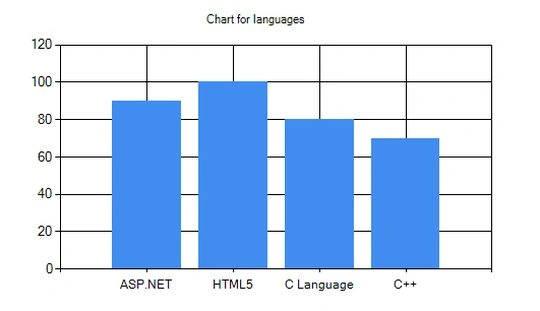
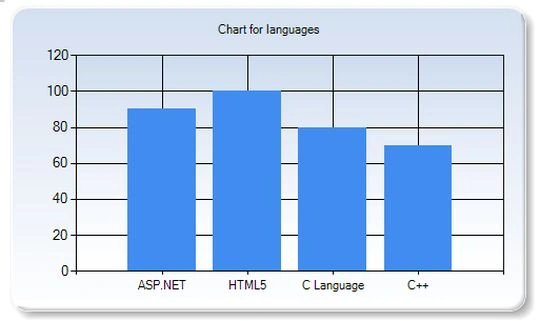
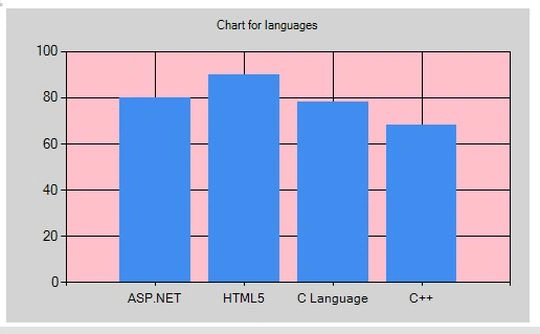
Simon BrownPosted May 11, 2021, 4:22 PM
Is there a reference document for the theme XML tags and attributes, not been able to find anything to allow me to refine charts I am creating?
Eron NamuggaPosted Feb 16, 2020, 9:29 AM
How to I display the chart in my pages?
Michael EasterbrookPosted Jun 26, 2017, 10:28 AM
How do I prevent the chart from starting at zero if I am using a SQL query as the data source? The query returns values starting at 7 but the chart starts at zero.
Murthy RampalliPosted Jun 12, 2017, 3:38 AM
Can we hide gridlines