
Here is an example
of creating simple charts using GDI+ commands in C#. I have used the random
class to create 5 random percentage values. I then use GDI+ to plot these values
on a chart.
I have used a timer control that creates an event once every second. My code for
this event is simply the Invalidate command. This forces the form to be
refreshed.
My main code is in the OnPaint method. This code is responsible for creating the chart each time the timer event fires. The code is pretty self explanatory. Any problems feel free to email me.
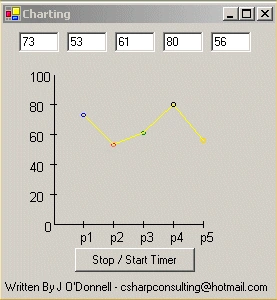
Here is a screenshot of the application and after that, the source code to the OnPaint method.
Protected Overrides Sub OnPaint(ByVal e As PaintEventArgs)
Dim pointarray As Point()
= New Point(4){}
Dim r As Random
= New Random()
Me.Value1.Text=r.Next(100).ToString()
Me.Value2.Text=r.Next(100).ToString()
Me.Value3.Text=r.Next(100).ToString()
Me.Value4.Text=r.Next(100).ToString()
Me.Value5.Text=r.Next(100).ToString()
Dim a As Single=Convert.ToInt32(Me.Value1.Text.ToString())
a=a*3
a=a/2
a=150-a
Dim b As Single=Convert.ToInt32(Me.Value2.Text.ToString())
b=b*3
b=b/2
b=150-b
Dim c As Single=Convert.ToInt32(Me.Value3.Text.ToString())
c=c*3
c=c/2
c=150-c
Dim d As Single=Convert.ToInt32(Me.Value4.Text.ToString())
d=d*3
d=d/2
d=150-d
Dim f As Single=Convert.ToInt32(Me.Value5.Text.ToString())
f=f*3
f=f/2
f=150-f
Dim newpen As Pen
= New Pen(Color.Black)
Dim g As Graphics=Graphics.FromHwnd(Me.Handle)
'Set
point of origin to be 50,50 on the form
g.TranslateTransform(50,50)
g.DrawLine(newpen,1,1,1,150)
g.DrawLine(newpen,1,150,150,150)
'Draw
X and y axis
g.DrawLine(newpen,-3,30,3,30)
g.DrawLine(newpen,-3,60,3,60)
g.DrawLine(newpen,-3,90,3,90)
g.DrawLine(newpen,-3,120,3,120)
g.DrawLine(newpen,30,147,30,153)
g.DrawLine(newpen,60,147,60,153)
g.DrawLine(newpen,90,147,90,153)
g.DrawLine(newpen,120,147,120,153)
g.DrawLine(newpen,150,147,150,153)
Dim newfont As Font
= New Font("Arial",10)
Join the conversation! Your thoughts help the community grow.