

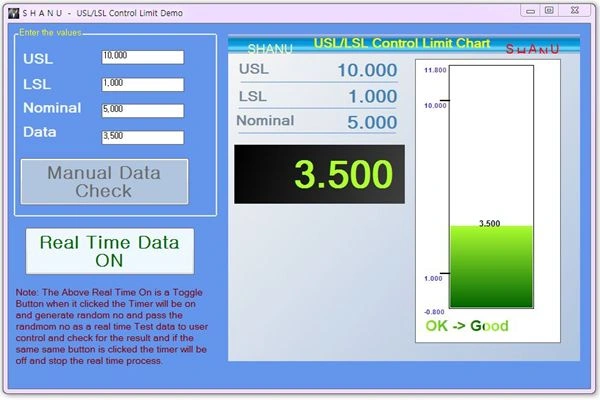
Introduction
Nowadays the automobile industry is interested in automated measuring machines to ensure quality and to compete in the global industry. Control Charts take a major role in ensuring quality by measuring automobile components. The purpose of this article is to make a simple Control Bar Chart for measuring systems like Camshafts, Crankshafts and Master Settings and so on. A digital sensor is used for measuring a Camshaft and a Crankshaft. Then the measured data is analyzed using the Control Chart.
Control Chart (ref)
The Control Charts are graphs for checking the quality of a control of a process. In Control Charts UCL/LCL or USL/LSL will be used to check with the resultant data. If the measurement data is within the range of limits then the process is OK(GOOD). If the measurement data is above or below the limits then the process is NG (NOT GOOD).
- OK (GOOD) -> USL <= Measurement Data >= LSL
- NG (NOT GOOD) -> Upper Range -> Measurement Data > USL
- NG (NOT GOOD) -> Lower Range -> Measurement Data < LSL
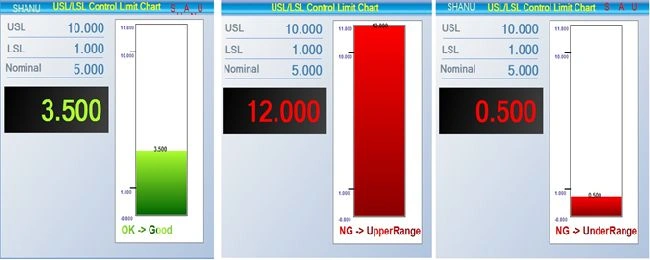
In my simple Control Chart USL /LSL is used for verifying the data. USL is the Upper Specification Limit and LSL is the Lower Specification Limit. Note in this sample I have used USL/LSL.
Difference between USL/LSL and UCL/LCL
(The UCL or Upper Control Limit and LCL or Lower Control Limit are limits set by your process based on the actual amount of variation of your process. The USL or upper specification limit and LSL or lower specification limit are limits set by your customer's requirements. This is the variation that they will accept from your process. Ref)
I have been working on several automation projects. Instead of using third-party tools, I planned to create a simple program using .Net for creating a USL/LSL Control Bar chart for the master setting. The main purpose of this article is to share what I have developed to other members.
I have created a Control Chart as a User Control so that it can be used easily in all projects.
In this article I have attached a Zip file named SHANUControlChart_SRC.zip which contains:
- "SHANUControlChart_CNT" Folder (This folder contains the Control Chart User control Source code.)
- "SHANUControlChart_DEMO" Folder (This folder conains the Demo program that includes the Control Chart user control with Random Measurement sample using Timer control).
Using the code
1. First we will start with the User Control. To Create a user control:
- Create a new Windows Control Library project.
- Set the name of the project and click Ok (here my user control name is SHANUControlChart_CNT).
- Add all the controls that is needed.
- In the code behind declare all the public variables and Public property variables. Here USL/LSL/Nominal and Measurement Data Public property has been declared which will be used to pass the data from the Windows application.
- 'Public Property Declaration
- Public Property MasterData() As String
- Get
- Return lblMasterData.Text
- End Get
- Set(value As String)
- lblMasterData.Text = value
- End Set
- End Property
- Public Property USLData() As String
- Get
- Return lblUslData.Text
- End Get
- Set(value As String)
- lblUslData.Text = value
- End Set
- End Property
- Public Property LSLData() As String
- Get
- Return lblLslData.Text
- End Get
- Set(value As String)
- lblLslData.Text = value
- End Set
- End Property
- Public Property NominalData() As String
- Get
- Return lblNominalData.Text
- End Get
- Set(value As String)
- lblNominalData.Text = value
- End Set
- End Property
- In my User Control I used a Timer control to always check for the measurment data and produce the Bar Chart.in the user control load. I have enabled and started the timer. The timer Tick Event calls the function "LoadcontrolChart()". In this fucntion I set all the USL/LSL and measurement data and draw the Chart Control.
In this method we check the measurement data with the USL and LSL limit values. If the measurement data is within the range of USL and LSL then the output will be Ok. I have used the if condition to check the values as below.- Public Sub LoadcontrolChart()
- Try
- 'For Barand GageLoad
- upperLimitChk = False
- lowerLimitchk = False
- errLimtchk = False
- Dim pointVal As Integer
- Dim calcvalues As Double
- Dim calcvalues1 As Double
- ' Dim upperValue As Double
- Dim hasread As Integer
- Dim UpperRange As Double
- Dim err As String
- pointVal = 3
- Dim ival As Integer
-
- sensordata = Convert.ToDouble(lblMasterData.Text.Trim())
- frmMasteringPictuerBox.Refresh()
- upperValue = System.Convert.ToDouble(lblUslData.Text)
- lovervalue = System.Convert.ToDouble(lblLslData.Text)
- If upperValue = lovervalue Then
- lovervalue = lovervalue - 1
- End If
- inputValue = System.Convert.ToDouble(lblMasterData.Text)
- 'here we call the draw ractangle fucntion
- drawRectanles(barheight, barwidth, upperValue, lovervalue, loverInitialvalue, upperInititalvalue, xval, yval)
-
- Catch ex As Exception
- End Try
- End Sub
- ''This method is to draw the control chart
- Public Sub drawRectanles(ByVal barheight As Double, ByVal barwidth As Double, ByVal uppervalue As Double, ByVal lovervalue As Double, ByVal loverinitialvalue As Double, ByVal upperinitialvalue As Double, ByVal xval As Double, ByVal yval As Double)
- Try
- Dim limitsline As Double
- Dim lowerlimitline As Double
- Dim underrange As Double
- Dim upperrange As Double
- Dim differentpercentage As Double
- Dim totalheight As Double
- Dim inputvalueCal As Double
- Dim finaldisplayvalue As Double
- Dim backColors1 As Color
- Dim backColors2 As Color
- 'this is for the range persentage Calculation
- differentpercentage = uppervalue - lovervalue
- differentpercentage = differentpercentage * 0.2
- 'Upper range value
- upperrange = uppervalue + differentpercentage
- 'Lover range value
- underrange = lovervalue - differentpercentage
- totalheight = upperrange - underrange
- 'For Upper Limit
- ''limitsline = barheight * 0.2 - 10
- limitsline = lovervalue - underrange
- limitsline = limitsline / totalheight
- limitsline = barheight * limitsline + 10
- 'For Lower Limit
- lowerlimitline = uppervalue - underrange
- lowerlimitline = lowerlimitline / totalheight
- lowerlimitline = barheight * lowerlimitline + 10
- 'lowerlimitline = barheight - limitsline + 10
- 'for finding the rangedata
- inputvalueCal = inputValue - underrange
- finaldisplayvalue = inputvalueCal / totalheight
- finaldisplayvalue = barheight * finaldisplayvalue
- Dim g As Graphics = frmMasteringPictuerBox.CreateGraphics
- Dim f5 As Font
- f5 = New Font("arial", 22, FontStyle.Bold, GraphicsUnit.Pixel)
- ''If condition to check for the result and display the chart accordingly depend on limit values.
- If inputValue = "0.000" Then
- If zeroDisplay = 0 Then
- backColors1 = Color.Red
- backColors2 = Color.DarkRed
- Dim a5 As New System.Drawing.Drawing2D.LinearGradientBrush(New RectangleF(0, 0, 90, 19), backColors1, backColors2, Drawing.Drawing2D.LinearGradientMode.Horizontal)
- g.DrawString("NG -> UnderRange", f5, a5, System.Convert.ToInt32(xval) - 40, barheight + 24)
- lblMasterData.ForeColor = Color.Red
- frmMasteringlblmsg.Text = "NG -> UnderRange"
- Else
- backColors1 = Color.GreenYellow
- backColors2 = Color.DarkGreen
- Dim a5 As New System.Drawing.Drawing2D.LinearGradientBrush(New RectangleF(0, 0, 90, 19), backColors1, backColors2, Drawing.Drawing2D.LinearGradientMode.Horizontal)
- g.DrawString("OK -> Good", f5, a5, System.Convert.ToInt32(xval) - 40, barheight + 24)
- lblMasterData.ForeColor = Color.GreenYellow
- frmMasteringlblmsg.Text = "OK -> Good"
- End If
- ElseIf inputValue >= lovervalue And inputValue <= uppervalue Then
- backColors1 = Color.GreenYellow
- backColors2 = Color.DarkGreen
- If upperLimitChk = False Then
- backColors1 = Color.GreenYellow
- backColors2 = Color.DarkGreen
- lblMasterData.ForeColor = Color.GreenYellow
- Else
- backColors1 = Color.Red
- backColors2 = Color.DarkRed
- lblMasterData.ForeColor = Color.Red
- End If
- Dim a5 As New System.Drawing.Drawing2D.LinearGradientBrush(New RectangleF(0, 0, 100, 19), backColors1, backColors2, Drawing.Drawing2D.LinearGradientMode.Horizontal)
- g.DrawString("OK -> Good", f5, a5, System.Convert.ToInt32(xval) - 40, barheight + 24)
- frmMasteringlblmsg.Text = "OK -> Good"
- 'frmMasteringlblOrignalData.ForeColor = Color.GreenYellow
- ElseIf inputValue < lovervalue Then
- backColors1 = Color.Red
- backColors2 = Color.DarkRed
- Dim a5 As New System.Drawing.Drawing2D.LinearGradientBrush(New RectangleF(0, 0, 100, 19), backColors1, backColors2, Drawing.Drawing2D.LinearGradientMode.Horizontal)
- g.DrawString("NG -> UnderRange", f5, a5, System.Convert.ToInt32(xval) - 40, barheight + 24)
- lblMasterData.ForeColor = Color.Red
- 'frmMasteringlblOrignalData.ForeColor = Color.Red
- frmMasteringlblmsg.Text = "NG -> UnderRange"
- ElseIf inputValue > uppervalue Then
- backColors1 = Color.Red
- backColors2 = Color.DarkRed
- Dim a5 As New System.Drawing.Drawing2D.LinearGradientBrush(New RectangleF(0, 0, 100, 19), backColors1, backColors2, Drawing.Drawing2D.LinearGradientMode.Horizontal)
- g.DrawString("NG -> UpperRange", f5, a5, System.Convert.ToInt32(xval) - 40, barheight + 24)
- lblMasterData.ForeColor = Color.Red
- 'frmMasteringlblOrignalData.ForeColor = Color.Red
- frmMasteringlblmsg.Text = "NG -> UpperRange"
- Else
- backColors1 = Color.Red
- backColors2 = Color.DarkRed
- Dim a5 As New System.Drawing.Drawing2D.LinearGradientBrush(New RectangleF(0, 0, 100, 19), backColors1, backColors2, Drawing.Drawing2D.LinearGradientMode.Horizontal)
- g.DrawString("Not Good", f5, a5, System.Convert.ToInt32(xval) - 40, barheight + 24)
- lblMasterData.ForeColor = Color.Red
- frmMasteringlblmsg.Text = "Not Good"
- End If
- Dim apen As New Pen(Color.Black, 2)
- g.DrawRectangle(Pens.Black, System.Convert.ToInt32(xval) - 2, System.Convert.ToInt32(yval) - 2, System.Convert.ToInt32(barwidth) + 3, System.Convert.ToInt32(barheight) + 3)
- g.DrawLine(apen, System.Convert.ToInt32(xval) - 15, System.Convert.ToInt32(limitsline), System.Convert.ToInt32(xval), System.Convert.ToInt32(limitsline))
- g.DrawLine(apen, System.Convert.ToInt32(xval) - 15, System.Convert.ToInt32(lowerlimitline), System.Convert.ToInt32(xval), System.Convert.ToInt32(lowerlimitline))
- Dim a1 As New System.Drawing.Drawing2D.LinearGradientBrush(New RectangleF(0, 0, 100, 19), Color.Blue, Color.Orange, Drawing.Drawing2D.LinearGradientMode.Horizontal)
- Dim f As Font
- f = New Font("arial", 10, FontStyle.Bold, GraphicsUnit.Pixel)
- g.DrawString((String.Format("{0:N3}", CDbl(uppervalue.ToString))), f, a1, System.Convert.ToInt32(xval) - 40, System.Convert.ToInt32(limitsline) + 1)
- g.DrawString((String.Format("{0:N3}", CDbl(lovervalue.ToString))), f, a1, System.Convert.ToInt32(xval) - 40, System.Convert.ToInt32(lowerlimitline) + 1)
- g.DrawString((String.Format("{0:N3}", CDbl(upperrange.ToString))), f, a1, System.Convert.ToInt32(xval) - 40, 9)
- g.DrawString((String.Format("{0:N3}", CDbl(underrange.ToString))), f, a1, System.Convert.ToInt32(xval) - 40, barheight + 10)
- Dim a As New System.Drawing.Drawing2D.LinearGradientBrush(New RectangleF(xval, barheight + 10, barwidth, finaldisplayvalue + 1), backColors1, backColors2, Drawing.Drawing2D.LinearGradientMode.Vertical)
- Dim a2 As New System.Drawing.Drawing2D.LinearGradientBrush(New RectangleF(0, 0, 100, 19), Color.Black, Color.Black, Drawing.Drawing2D.LinearGradientMode.Horizontal)
- Dim f2 As Font
- f2 = New Font("arial", 12, FontStyle.Bold, GraphicsUnit.Pixel)
- If inputValue >= upperrange Then
- g.FillRectangle(a, New RectangleF(xval, 10, barwidth, barheight))
- g.DrawString((String.Format("{0:N3}", CDbl(inputValue.ToString))), f2, a2, System.Convert.ToInt32(xval) + 40, yval - 8)
- ElseIf inputValue <= underrange Then
- g.FillRectangle(a, New RectangleF(xval, barheight + 10, barwidth, 4))
- g.DrawString((String.Format("{0:N3}", CDbl(inputValue.ToString))), f2, a2, System.Convert.ToInt32(xval) + 40, barheight + 10)
- Else
- g.FillRectangle(a, New RectangleF(xval, barheight - finaldisplayvalue + 10, barwidth, finaldisplayvalue))
- g.DrawString((String.Format("{0:N3}", CDbl(inputValue.ToString))), f2, a2, System.Convert.ToInt32(xval) + 40, barheight - System.Convert.ToInt32(finaldisplayvalue))
- End If
- ' End If
- g.Dispose()
- Catch ex As Exception
- End Try
- End Sub
- After completion, save, build and run the project.
2. Now we create a Windows application and add and test our "SHANUControlChart_CNT" User Control.
- Create a new Windows project.
- Open your form and then from the Toolbox right-click then choose items > browse then select your User Control DLL and add it.
- Drag the User Control to your Windows form.
- Place all the USL/LSL and Measurement TextBox for input from the user. In the Manual check button click pass all the data to the User Control using the public property as below.
- private void btnDisplay_Click(object sender, EventArgs e)
- {
- shanuControlChart.USLData = txtusl.Text;
- shanuControlChart.LSLData = txtLSL.Text;
- shanuControlChart.NominalData = txtNominal.Text;
- shanuControlChart.MasterData = txtData.Text;
- }
- In my demo program I have used the timer for the randomly sampled measurement data result checking. I have used the "btnRealTime" as a toggle button. When the first time Enabled is clicked and start the timer and when the same button is clicked again the timer is stopped. When the timer is started I generated a random number and pass the various data to the User Control and check for the chart result.
- private void btnRealTime_Click(object sender, EventArgs e)
- {
- if (btnRealTime.Text == "Real Time Data ON")
- {
- btnRealTime.Text = "Real Time Data OFF";
- btnRealTime.ForeColor = Color.Red;
- timer1.Enabled = true;
- timer1.Start();
- }
- else
- {
- btnRealTime.Text = "Real Time Data ON";
- btnRealTime.ForeColor = Color.DarkGreen;
- timer1.Enabled = false;
- timer1.Stop();
- }
- }
- / Timer Tick Event to check for the different random sample Measurement test data.
- private void timer1_Tick(object sender, EventArgs e)
- {
- Random rnd =new Random();
- Double rndval = rnd.Next(1, 20);
- txtData.Text = rndval.ToString("0.000");//FormatNumber(rndval.ToString(), 3, , 0)
- shanuControlChart.USLData = txtusl.Text;
- shanuControlChart.LSLData = txtLSL.Text;
- shanuControlChart.NominalData = txtNominal.Text;
- shanuControlChart.MasterData = txtData.Text;
- }
Conclusion
The main purpose of this article is to create a simple and standard Control Bar Chart User Control for the automobile industry.
Syed ShanuPosted Jul 14, 2014, 8:26 PM
Nop i dont know about OBD .But what is the relation between OBD and this Article.
Sam HobbsPosted Jul 14, 2014, 7:31 PM
Are you familiar with On-Board Diagnostic (OBD) Systems as in: http://www.cvel.clemson.edu/auto/systems/OBD.html