

Introduction
For years, getting answers from business data followed the same slow path: someone asks a question, an analyst builds a report, the report gets reviewed, revised, and finally shared, often days after the question was first asked. Microsoft Copilot in Power BI is changing that rhythm. By bringing generative AI directly into the reporting experience, Copilot lets business users ask questions of their data in plain language and let’s report authors build pages, write DAX, and document models in a fraction of the usual time.
This article walks through what Copilot in Power BI actually is, where you will find it, what it can do for different roles, what you need before you can switch it on, and the best practices and limitations you should know before rolling it out to your organization.
What Is Copilot in Power BI?
Copilot in Power BI is Microsoft's generative-AI assistant built into Power BI Desktop and the Power BI service (as part of Microsoft Fabric). It provides chat-based experiences that adapt to who is using it: business users get on-the-fly analysis and plain-language answers, while advanced creators get help with report building and data analysis expressions (DAX). Rather than replacing analysts, Copilot compresses the distance between a question and an answer, it drafts, you verify and refine.
Copilot is enabled by default in eligible tenants, although administrators can turn it off in the Fabric admin portal. Some experiences are generally available (the Copilot pane inside reports), while others, such as the full-screen standalone Copilot, Copilot in apps, and the mobile experiences, are in preview and continue to evolve.
Where You'll Find Copilot
Copilot isn't a single button, it surfaces in several places across the Power BI ecosystem, each designed for a different working style:
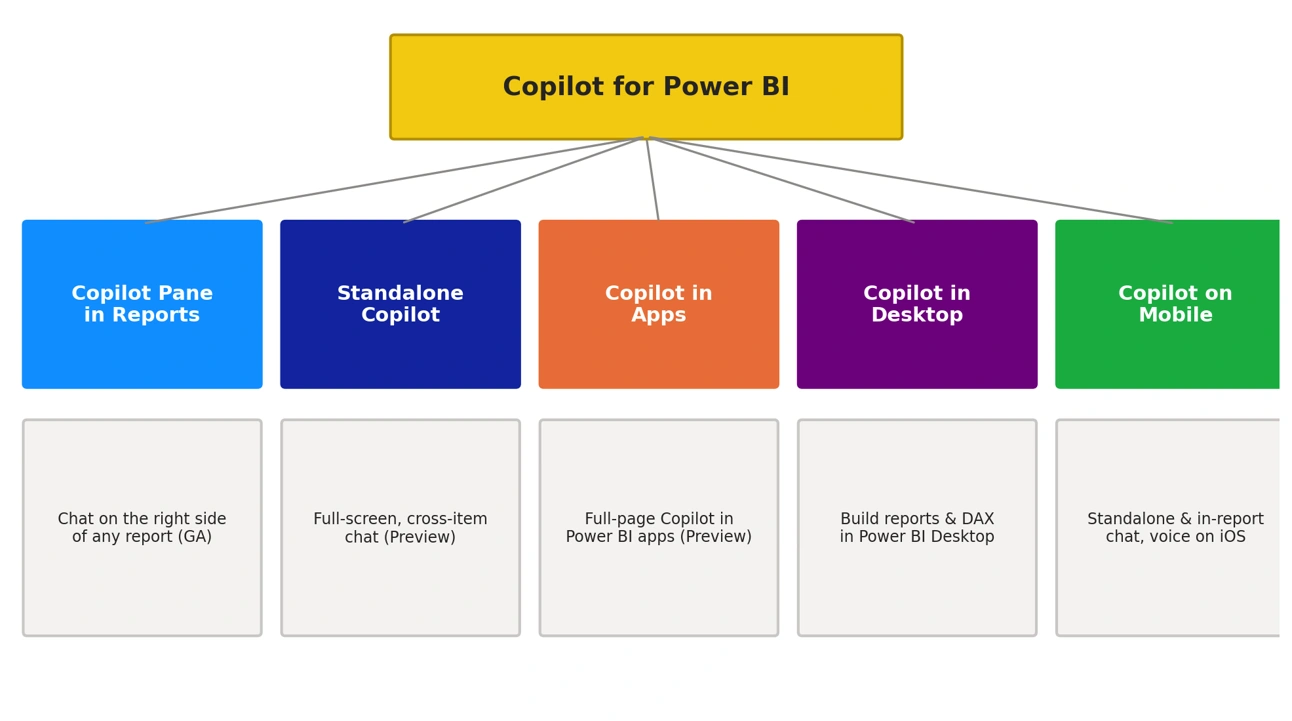
Figure 1: The five main Copilot experiences across the Power BI ecosystem.
Copilot pane in reports. A chat panel on the right side of an open report. Ask questions about the report's data, request summaries, and dig into insights without leaving the report. This is the generally available experience most users meet first.
Standalone Copilot. A full-screen, cross-item chat opened from the Power BI left navigation (preview). It can query reports, semantic models, and data agents across your organization, useful when you don't even know which report holds the answer.
Copilot in apps. A full-page Copilot inside a Power BI app's navigation (preview), scoped to that app's content. App publishers control it per app under advanced settings.
Copilot in Power BI Desktop. Authoring-focused Copilot for building report pages, generating narrative visuals, writing DAX queries, and creating measure descriptions while you develop.
Copilot on mobile. Standalone and in-report chat in the Power BI mobile apps (preview), including voice dictation on iPhone and iPad, with shareable responses and visuals.
What Copilot Can Do
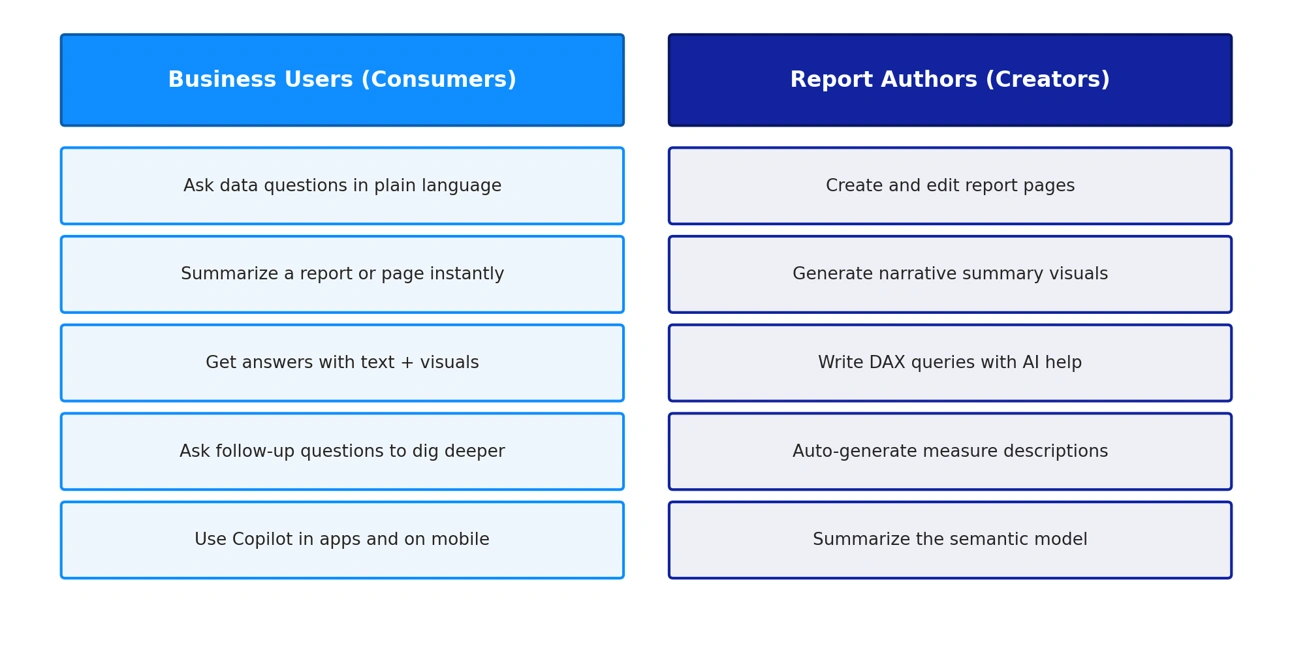
Figure 2: Copilot capabilities differ by role, consumption on the left, creation on the right.
For business users: ask, summarize, understand
The consumer experience is deliberately simple. Open a report, open the Copilot pane, and type a question the way you would ask a colleague: "Why did sales dip in March?" or "Summarize this page for an executive update." Copilot answers with text and, where appropriate, interactive visuals, and you can keep asking follow-ups. Under the hood, report summaries and answers follow a two-step process: Copilot first identifies the most relevant visuals on the report (up to 20), then summarizes or answers using the data those visuals present.
Prompts can be long and specific, Copilot for Power BI supports up to 10,000 characters per prompt across all surfaces, so you can supply real context: the audience, the time frame, the metrics that matter.
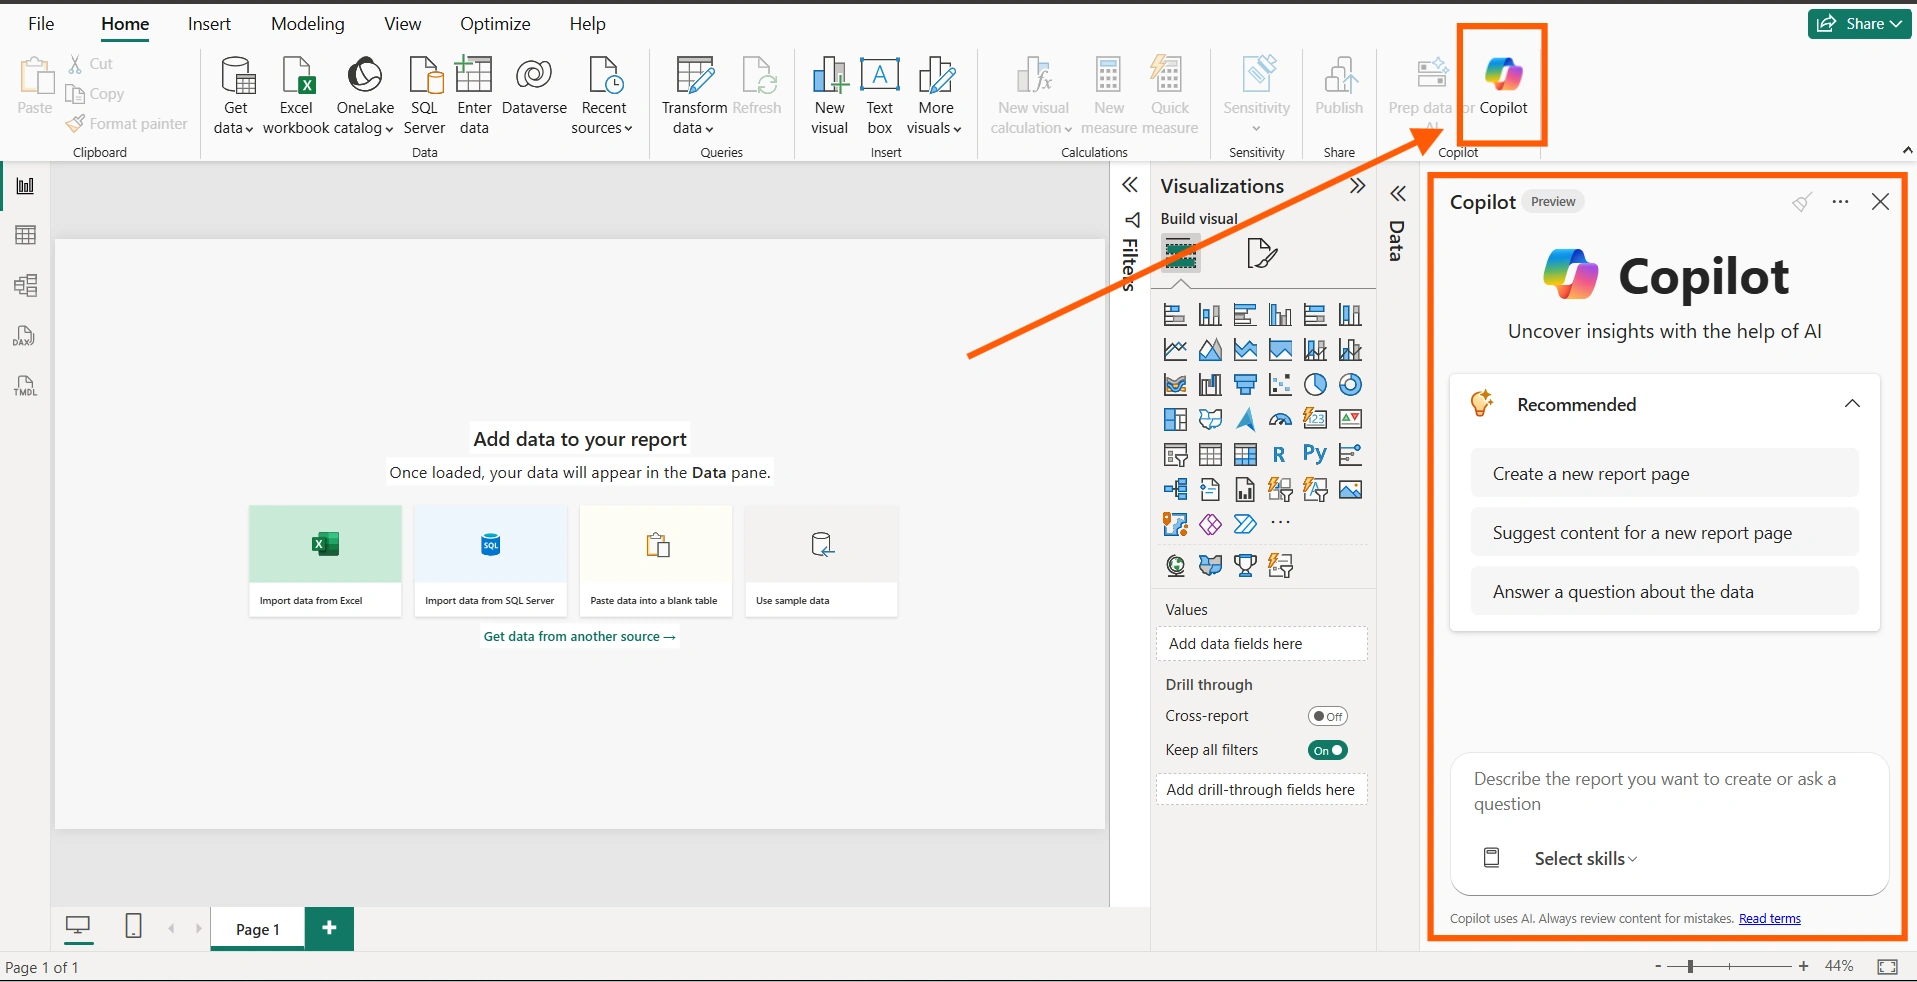
Figure 3: Copilot in Power BI
For report authors: create, edit, and document faster
Create and edit report pages. Describe the page you want and Copilot builds it, choosing suitable visual types. You can then ask it to add, change, or delete visuals on existing pages, and use undo/redo to reverse its actions.
Generate narrative visuals. Add an AI-generated summary directly onto the report canvas. It can cover the whole report, specific pages, or selected visuals, includes footnote references back to the visuals it drew from, and refreshes on demand. Prompts let you control tone, focus, and formatting.
Write DAX queries. Describe the query you need in plain language and Copilot drafts the DAX. Review it, keep it, and run it, a genuine accelerator for both learners and experts.
Add measure descriptions. Copilot can write descriptions for your semantic model measures, turning a chore into a click and giving downstream report builders essential documentation.
Summarize the semantic model. Ask Copilot to describe the tables, relationships, and measures in a model, a fast orientation when inheriting someone else's work.
Requirements and Setup
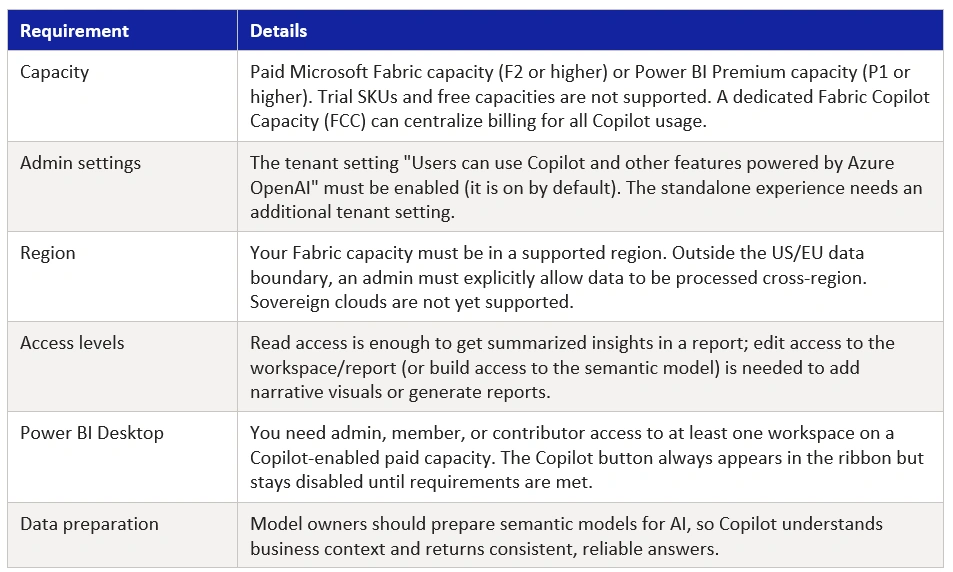
Copilot's biggest surprise for many teams isn't a feature, it's the licensing prerequisite. A Power BI Pro or Premium Per User license alone is not sufficient; Copilot requires organizational capacity.
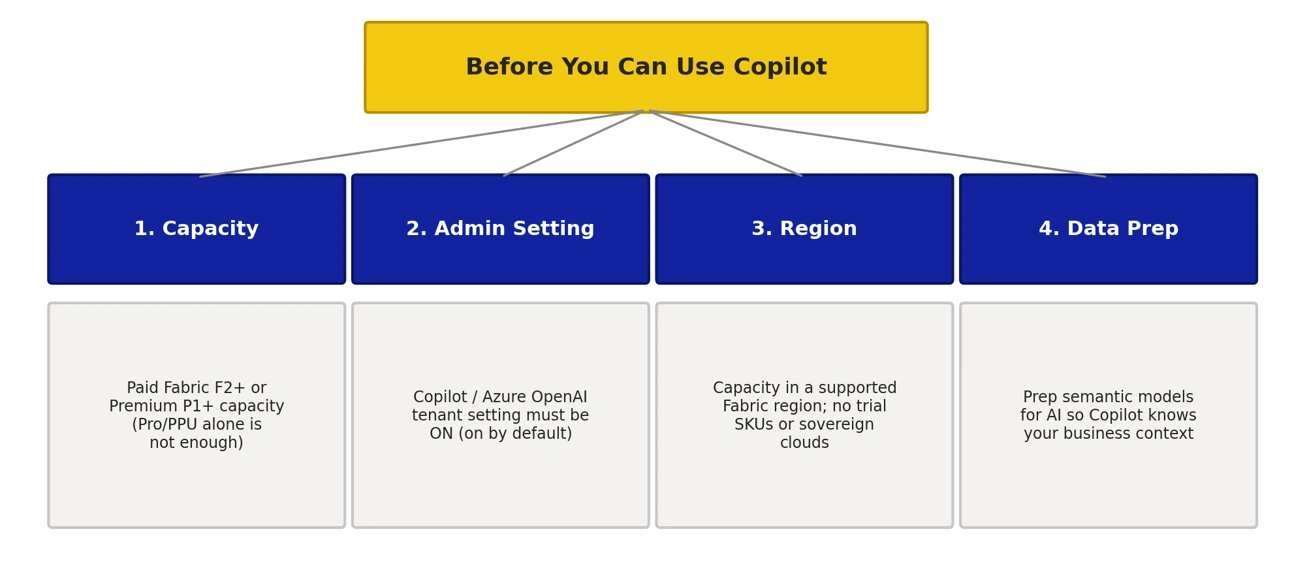
Figure 4: The four things to confirm before rolling out Copilot
Getting Started: A Quick Walkthrough
Check prerequisites. Confirm with your Fabric admin that Copilot is enabled and your workspace sits on an F2+/P1+ capacity in a supported region.
Open a report and launch Copilot. In the Power BI service, open any report in a Copilot-enabled workspace and select the Copilot button in the ribbon; the pane opens on the right.
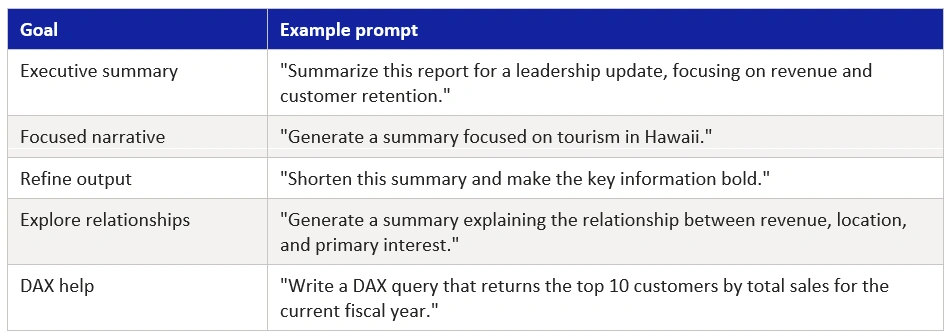
Start with a summary. Try "Summarize this report" or a suggested prompt. Then get specific: "Summarize Q2 revenue by region and highlight the biggest change versus Q1."
Create a report page. In Desktop or the service (with edit access), describe a page: "Create a page showing sales trends by product category with a monthly breakdown." Refine with follow-ups, add, swap, or remove visuals.
Add a narrative visual. From the Visualizations pane, select the Narrative visual and choose Copilot mode. Scope it to the whole report, a page, or selected visuals, then adjust with prompts such as "Shorten this summary and bold the key figures."
Verify everything. Answers are drafts, not gospel. Read the summary, check footnote references, and validate numbers before sharing. Use the clear-chat button when switching topics so stale context doesn't muddy responses.
Preparing Your Data for AI
Microsoft is blunt about this: you need to prepare your data to work well with Copilot. Without preparation, Copilot can struggle to interpret a model correctly, producing generic, inaccurate, or misleading output. Preparation means investing in the semantic model itself:
Use clear, business-friendly names for tables, columns, and measures, Copilot reads them to understand meaning.
Add descriptions to measures (Copilot can help write these) so the model is self-documenting.
Mark relationships and data categories correctly and enable the Q&A feature switch for models used in report creation.
Curate what matters: hide clutter and prioritize the fields users actually ask about, so Copilot surfaces the right information consistently.
Best Practices for Better Results
Design for Copilot. Keep report pages focused. Copilot summarizes from the top 20 relevant visuals, so a page with hundreds of visuals risks missed insights. Prefer distinct, simple visuals over one complex visual that shows everything.
Label clearly. Clear titles and axis labels matter, the narrative visual reads what is on the canvas, not the raw model, so well-labeled visuals produce better narratives.
Watch performance. Slow visuals slow Copilot. Use the diagnostics option in the Copilot menu to see per-visual query timings, and split or remove long-running visuals that aren't needed for answers.
Write specific prompts. State the audience, scope, and format you want. With a 10,000-character limit, there is room to be precise.
Understand caching. Identical prompts on an unchanged model may return cached responses within a 24-hour window; change the prompt or refresh the model if you expect something new. Clear the chat when switching topics.
Limitations and Considerations
Copilot cannot create report pages for real-time streaming models, live connections to Analysis Services, or models with implicit measures disabled.
Custom visuals and styling/formatting changes are not supported in report creation; complex visual changes may lose detail.
The narrative visual's body cannot be edited directly, you refine it through prompts (or copy the text into a classic smart narrative for manual editing). It must also be refreshed after filtering to reflect current data.
Summaries reflect visualized data, and sampling on very large volumes can reduce accuracy, human review remains essential.
• Copilot availability depends on capacity, region, and admin settings, and several experiences are still in preview and subject to change.
On privacy and security: Copilot experiences are powered by Azure OpenAI within the Microsoft Fabric trust boundary, with admin controls governing whether data may be processed outside your region. Organizations with strict data-residency requirements should review Microsoft's "Privacy, security, and responsible use for Copilot in Power BI" documentation before enabling cross-region processing.
Conclusion
Copilot in Power BI is not a magic analyst, it is a fast, tireless drafting partner. Business users get answers in seconds instead of tickets; authors get first drafts of pages, narratives, DAX, and documentation that would otherwise consume hours. The organizations seeing the most value treat it as a workflow change, not a feature toggle: they secure the right capacity, prepare their semantic models for AI, teach users to write specific prompts, and keep humans in the loop to verify results. Do those four things, and Copilot genuinely delivers what the title promises, faster, smarter reports.
Join the conversation! Your thoughts help the community grow.