

Introduction
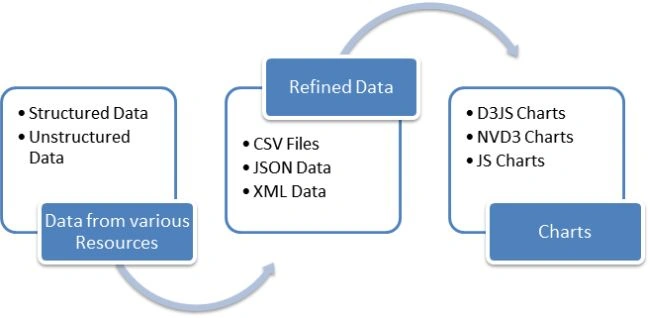
This article is all about how to use your data from various resources and generate some charts depending on your application requirements. In this article, I am using simple CSV data and D3JS for creating charts.
Agenda
- Overview
- Introduction | D3JS
- Problem
- Solution | Snippet
- HTML | Snippet
- JavaScript | Snippet
- CSS | Snippet
- Output
- Conclusion
Overview
In many applications, sometimes we need to use data from CSV files, SQL Server tabular data, JSON data, flat files, and so on. In data visualization (In generating charts like bar, pie, line charts, and so on and diagrams) depending on the requirements. This creates problems for developers since usually they don't know about it.
- How to do that?
- What do they need to use?
- What will be the better way of doing that?
- What kind of rough data is required?
- How to parse data?
- How to convert data from one to another form?
- How to represent?
And so on. So in this article, I'll try to explain it and present a demo of it.
So get ready for some creative and graphics work.
Introduction | D3JS
D3JS is a JavaScript library used for data visualization mostly. By data visualization I mean data, and information representation in the form of charts (Bar, Pie, Line, Area, Scatter, Histogram, Donut, and so on.) D3JS is widely used for its well-defined functionality and its workflow simplicity. In D3JS we need to use a few properties related to the respective chart and the work is over.
One of the major advantages of D3JS is that you don't need to spend too much to going through it since it is a part of JavaScript and uses a similar operation mode and functions like it. So if you are familiar with JavaScript then it's for you.
What you need to do is simply embed your JavaScript in your Simple HTML code and you're done. For decoration and formatting, you can use CSS and its related components.
I hope this much of an introduction to D3JS will be enough at this level. I'll try to write a basic introductory article on D3JS containing features, properties, application areas, advantages, scope, and so on.
Problem
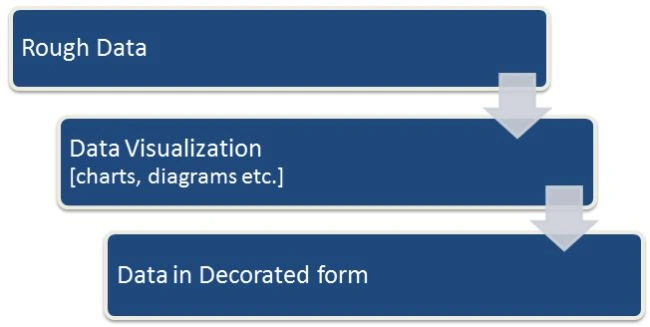
Suppose you have a humongous collection of data such as Population, account details, e-commerce, budgeting, surveys, and so on in rough form and you want to convert it into something better and easy to represent in an understandable form. Then Data Visualization is the best way to represent, understand, and summarize it.
You don't need any extra effort, just write a few lines of code, and your visualization of that rough data is completed.
Solution | Snippet
The solution is given below.
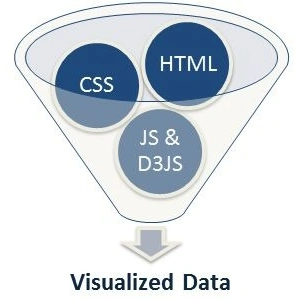
(By only using HTML, CSS, and D3JS.)
HTML | Snippet
<!DOCTYPE html PUBLIC "-//W3C//DTD XHTML 1.0 Strict//EN" "http://www.w3.org/TR/xhtml1/DTD/xhtml1-strict.dtd">
<html>
  <head>
    <title>Bar Chart</title>
    <meta http-equiv="X-UA-Compatible" content="IE=9">
    <link href="Style1.css" type="text/css" />
  </head>
  <body>
    <div id="chart"></div>
    <script src="http://d3js.org/d3.v2.min.js"></script>
    <script>
      function renderChart() {

        // var width = 1020,
        //     height = 720,
        var data = d3.csv.parse(d3.select('#csv').text());
        var valueLabelWidth = 40; // space reserved for value labels (right)
        var barHeight = 20; // height of one bar
        var barLabelWidth = 100; // space reserved for bar labels
        var barLabelPadding = 5; // padding between bar and bar labels (left)
        var gridLabelHeight = 18; // space reserved for gridline labels
        var gridChartOffset = 3; // space between start of grid and first bar
        var maxBarWidth = 420; // width of the bar with the max value

        // Accessor functions
        var barLabel = function(d) { return d['Name']; };
        var barValue = function(d) { return parseFloat(d['Salary(PM)']); };

        // Scales
        var yScale = d3.scale.ordinal().domain(d3.range(0, data.length)).rangeBands([0, data.length * barHeight]);
        var y = function(d, i) { return yScale(i); };
        var yText = function(d, i) { return y(d, i) + yScale.rangeBand() / 2; };
        var x = d3.scale.linear().domain([0, d3.max(data, barValue)]).range([0, maxBarWidth]);

        // Svg container element
        var chart = d3.select('#chart').append("svg")
          .attr('width', maxBarWidth + barLabelWidth + valueLabelWidth)
          .attr('height', gridLabelHeight + gridChartOffset + data.length * barHeight);

        // Grid line labels
        var gridContainer = chart.append('g')
          .attr('transform', 'translate(' + barLabelWidth + ',' + gridLabelHeight + ')');
        gridContainer.selectAll("text").data(x.ticks(10)).enter().append("text")
          .attr("x", x)
          .attr("dy", -3)
          .attr("text-anchor", "middle")
          .text(String);

        // Vertical grid lines
        gridContainer.selectAll("line").data(x.ticks(10)).enter().append("line")
          .attr("x1", x)
          .attr("x2", x)
          .attr("y1", 0)
          .attr("y2", yScale.rangeExtent()[1] + gridChartOffset)
          .style("stroke", "#ccc");

        // Bar labels
        var labelsContainer = chart.append('g')
          .attr('transform', 'translate(' + (barLabelWidth - barLabelPadding) + ',' + (gridLabelHeight + gridChartOffset) + ')');
        labelsContainer.selectAll('text').data(data).enter().append('text')
          .attr('y', yText)
          .attr('stroke', 'none')
          .attr('fill', 'black')
          .attr("dy", ".35em")
          .attr('text-anchor', 'end')
          .text(barLabel);

        // Bars
        var barsContainer = chart.append('g')
          .attr('transform', 'translate(' + barLabelWidth + ',' + (gridLabelHeight + gridChartOffset) + ')');
        barsContainer.selectAll("rect").data(data).enter().append("rect")
          .attr('y', y)
          .attr('height', yScale.rangeBand())
          .attr('width', function(d) { return x(barValue(d)); })
          .attr('stroke', 'Gray')
          .attr('fill', 'YellowGreen');

        // Bar value labels
        barsContainer.selectAll("text").data(data).enter().append("text")
          .attr("x", function(d) { return x(barValue(d)); })
          .attr("y", yText)
          .attr("dx", 3) // padding-left
          .attr("dy", ".35em") // vertical-align: middle
          .attr("text-anchor", "start") // text-align: right
          .attr("fill", "black")
          .attr("stroke", "none")
          .text(function(d) { return d3.round(barValue(d), 2); });

        // Start line
        barsContainer.append("line")
          .attr("y1", -gridChartOffset)
          .attr("y2", yScale.rangeExtent()[1] + gridChartOffset)
          .style("stroke", "#000");

      }
    </script>

    <!-- CSV Data -->
    <script id="csv" type="text/csv">
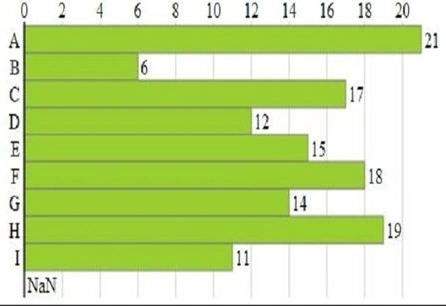
      Name,Salary(PM)
      A, 21k
      B, 6k
      C, 17k
      D, 12k
      E, 15k
      F, 18k
      G, 14k
      H, 19k
      I, 11k
    </script>
    <script>renderChart();</script>
  </body>
</html>
JavaScript | Snippet
The JavaScript code is embedded into the HTML snippet.
CSS | Snippet
html, body {
}
#chart {
    width: 100%;
    border: 1px solid;
}
#csv {
    width: 560px;
    height: 86px;
    overflow: hidden;
}
Output
Conclusion
So, for now, you will have at least a feel of why data visualization is necessary, why to do it, and what we need to use for visualization. If you have any queries related to this article, charts, data visualization, or D3Js then write back to me, I would love to answer your queries.
I hope you enjoyed this article. I'll write some introductory parts of D3JS and its related content in separate articles soon.
gunakar appalaPosted Jun 29, 2015, 12:20 AM
hi abhi give example of creating pie chart using d3,js
Abhishek JaiswalPosted Aug 23, 2014, 1:02 PM
Thank you sir! :)
Abhishek JaiswalPosted Aug 23, 2014, 1:00 PM
Yeah, thanks Sumit! :)
Mahesh ChandPosted Aug 23, 2014, 12:02 PM
Good writing, Abhi. I would change "Agenda" heading to "Table of Contents". Agenda is usually for meetings and webinars. Cheers!
Guest UserPosted Aug 23, 2014, 11:00 AM
Oh I see you've given reference of NVD3 in your diagram. JS Chart is paid library what I know, like high-chart
Guest UserPosted Aug 23, 2014, 10:57 AM
Abhishek good you posted an article on D3, it's indeed good library to use. But I use NVD3.js which is wrapper over D3, it saves lot of time over D3 as it has written wrapper over common D3 functionality