

Introduction
Scalable Vector Graphics (SVG) is an XML based vector image format for 2D graphics developed by the World Wide Web Consortium (W3C) in 1999. SVG images and their behaviors are defined in XML text files, which means they can be searched, indexed, scripted and compressed. Since XML files can be created and edited with any text editor, SVG images can also be created and edited with any text editor. All famous web browsers like Internet Explorer, Google Chrome, Mozilla Firefox, Safari and Opera support at least some degree of SVG rendering.
The following are some advantages of using SVG graphics:
- is Text-based
- is open source
- is written in XML format
- is an official W3C graphics standard
- is dynamic and updateable
- is cross-browser compatible
- can be animated
In addition, SVG images:
- are scalable
- can be printed at any resolution with great image quality
- can be zoomed to any level without losing clarity
With the change in technology, web development has changed very much. End-users demand better UI functionality in their web applications on both the browser and other mobile devices with some brilliant animations and graphics. With the introduction of some of the new features provided in HTML5, we can accomplish these requirements easily.
HTML5 supports inline Scalable Vector Graphics (SVG). As we know SVG is not a new feature and was introduced in 1999, but now HTML5 supports it with the <svg> tag. SVGs are awesome and can be compressed and scaled.
Creating Charts using SVG
The following is the procedure to create a chart using SVG.
Step 1
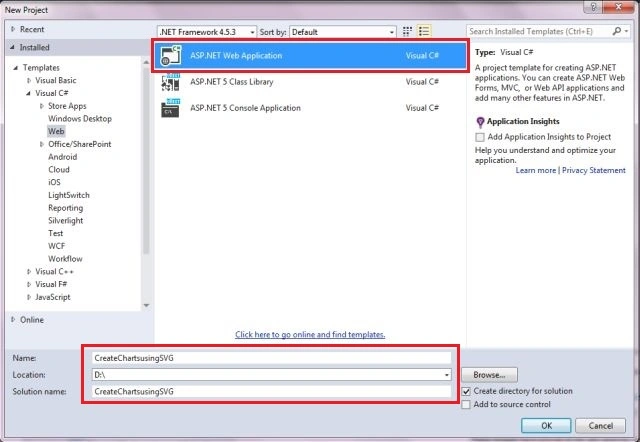
Open Visual Studio 2012/2013/2015 Preview or any other HTML5 editor. We are using Visual Studio 2015 Preview. Now create a new ASP.NET application by selecting the ASP.NET Web Application template and name your new project and select your preferred location.
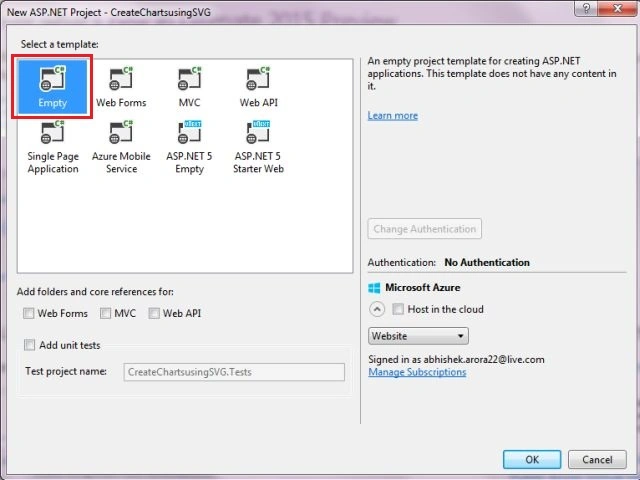
Now select the Empty project template.
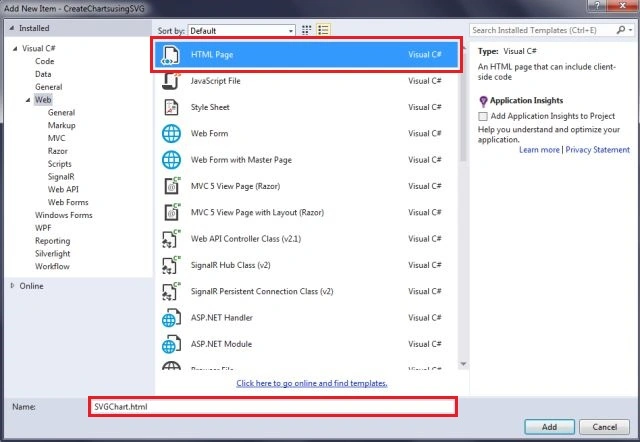
In this project add an HTML page and name it "SVGChart.html".
Step 2
In this "SVGChart.html" page add the following HTML code to the body section:
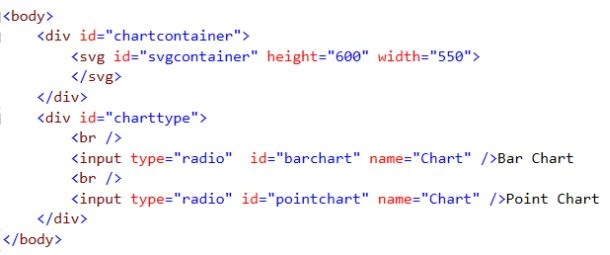
As we can see, we have defined an <svg> element in the preceding markup code. We will use this element as a container for the elements required for drawing the charts.
Step 3
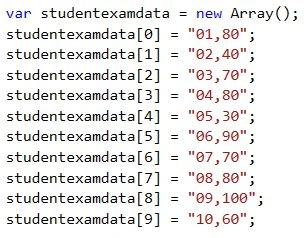
Let's create a student exam data chart based upon the following array. We can store the data in an array as shown below:
Step 4
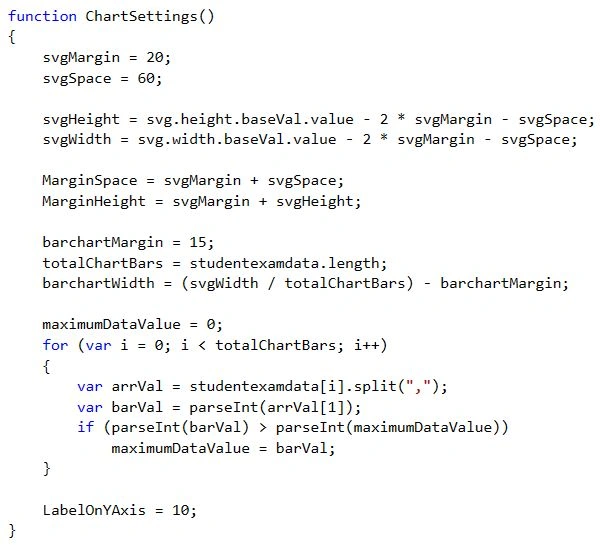
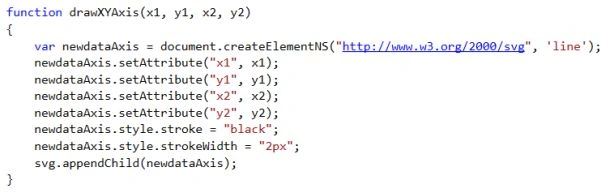
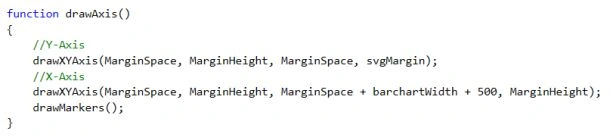
For the purpose of plotting the charts, we need to define both the X-axis and Y-axis and set the dimensions for them by declaring the following variables:

Step 5
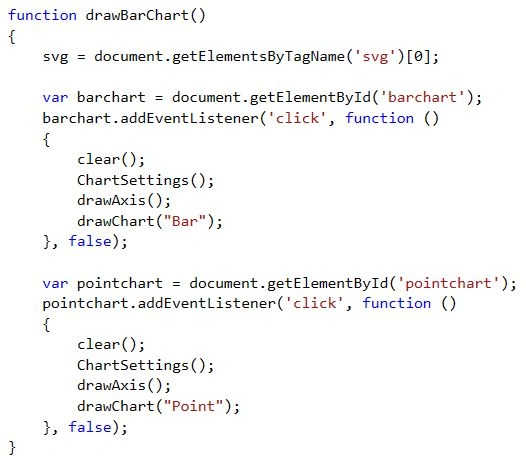
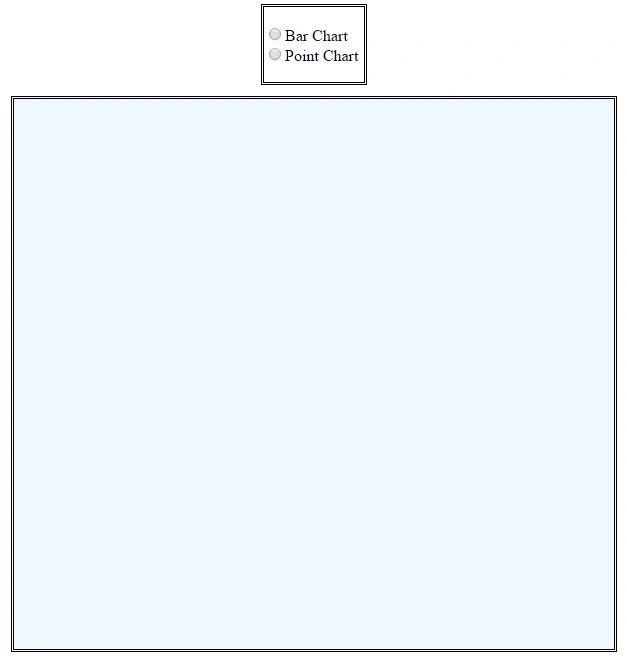
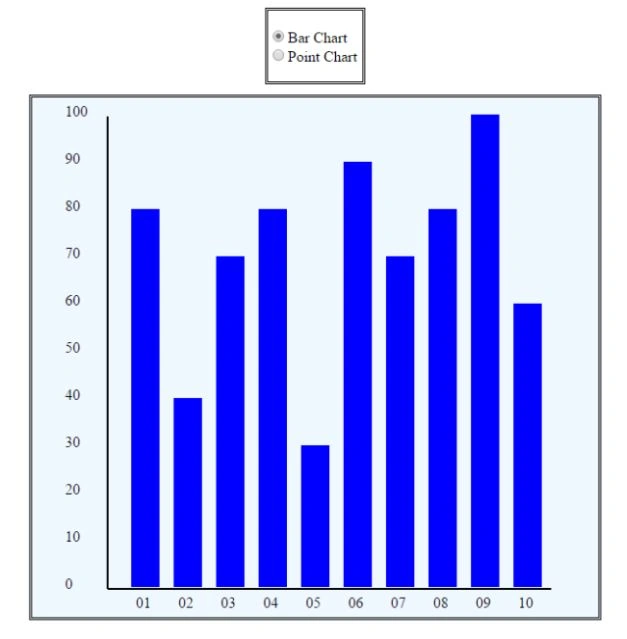
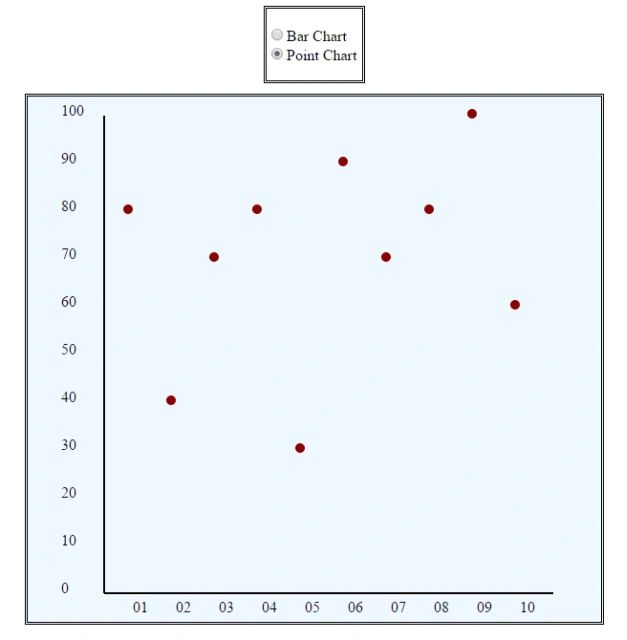
Sanjay GuptaPosted Jan 28, 2015, 8:37 AM
Great Work!
Elina RomanPosted Jan 28, 2015, 3:21 AM
wow,it seems very long.It really takes me a long time to see that. http://www.ourcase.co.uk
Vithal WadjePosted Jan 27, 2015, 10:06 PM
nice