

Introduction
In this article, I will implement 6 different types of charts in ASP.NET Core 2.1 MVC application using Google Charts API.
Different types of charts are:
- Column Chart
- Line Chart
- Pie Chart
- Area Chart
- Bar Chart
In all the above-mentioned charts, I want to show year-wise population data in the city.
Google Charts API
It is a freely available powerful tool for creating charts and easy to implement. It gives many features with different types of chart.
I am using this Google API <script type="text/javascript" src="https://www.gstatic.com/charts/loader.js"></script>
Prerequisites
- Install Visual studio 2017 updated any version
- Install .Net core SDK 2.1 or above
Step 1- Create an ASP.NET Core 2.1 MVC Project
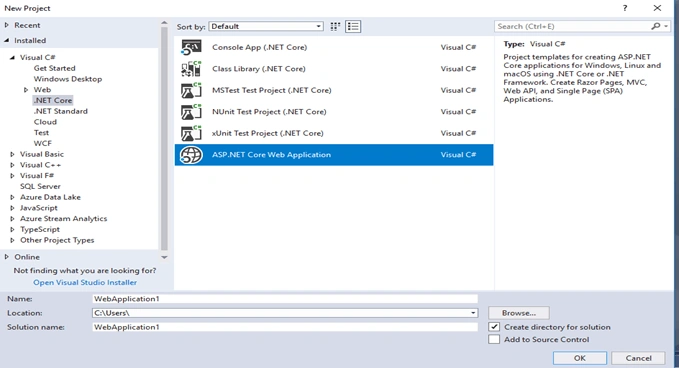
Open Visual Studio and select File -> New -> Project.
After selecting the project, a "New Project" dialog will open. Select .NET Core inside the Visual C# menu from the left side panel.
Then, select “ASP.NET Core web application“ from available project types. Give a name to the project as StackedChartwithCoreMVCDemo and press OK.
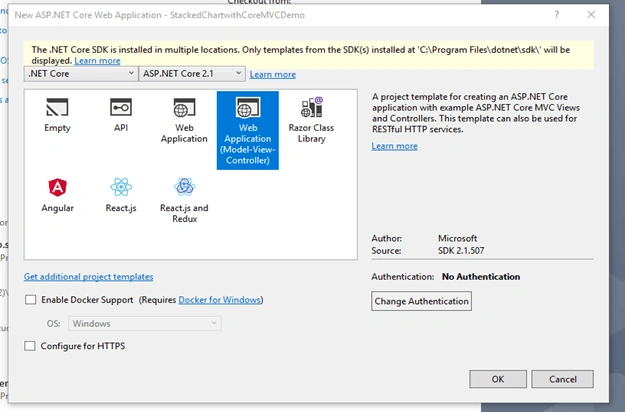
After clicking on the OK button, a new dialog will open to select the project template. You can saw two drop-down menus at the top left of the template window. Then, select “.NET Core” and “ ASP.NET Core 2.1” from these dropdowns. Select “ Web application (Model-View-Controller)” template and press OK to create Asp.Net Core MVC project.
Step 2 - Column Chart
Add a new class to Models folder as “PopulationModel” and add the following properties.
- namespace StackedChartwithCoreMVCDemo.Models
- {
- public class PopulationModel
- {
- public string CityName { get; set; }
- public int PopulationYear2020 { get; set; }
- public int PopulationYear2010 { get; set; }
- public int PopulationYear2000 { get; set; }
- public int PopulationYear1990 { get; set; }
- }
- }
Step 3
Add a new class to the Models folder for data access and name it as “PopulationDataAccessaLayer”.
- namespace StackedChartwithCoreMVCDemo.Models
- {
- public class PopulationDataAccessaLayer
- {
- public static List<PopulationModel> GetCityPopulationList()
- {
- var list = new List<PopulationModel>();
- list.Add(new PopulationModel { CityName = "PURI", PopulationYear2020 = 28000, PopulationYear2010 = 45000, PopulationYear2000 = 22000, PopulationYear1990 = 50000 });
- list.Add(new PopulationModel { CityName = "Bhubaneswar", PopulationYear2020 = 30000, PopulationYear2010 = 49000, PopulationYear2000 = 24000, PopulationYear1990 = 39000 });
- list.Add(new PopulationModel { CityName = "Cuttack", PopulationYear2020 = 35000, PopulationYear2010 = 56000, PopulationYear2000 = 26000, PopulationYear1990 = 41000 });
- list.Add(new PopulationModel { CityName = "Berhampur", PopulationYear2020 = 37000, PopulationYear2010 = 44000, PopulationYear2000 = 28000 , PopulationYear1990 = 48000 });
- list.Add(new PopulationModel { CityName = "Odisha", PopulationYear2020 = 40000, PopulationYear2010 = 38000, PopulationYear2000 = 30000 , PopulationYear1990 = 54000 });
- return list;
- }
- }
- }
Step 4
Add a new controller to the Controllers folder and name it as “ColumnChart”.
And, create a new Acton Result to display data in the View and load column chart.
- using Microsoft.AspNetCore.Mvc;
- using StackedChartwithCoreMVCDemo.Models;
- namespace StackedChartwithCoreMVCDemo.Controllers
- {
- public class ColumnChartController: Controller
- {
- // GET: /<controller>/
- public IActionResult Index()
- {
- return View();
- }
- [HttpGet]
- public JsonResult PopulationChart()
- {
- var populationList = PopulationDataAccessaLayer.GetCityPopulationList();
- return Json(populationList);
- }
- }
- }
Step 5
Add a new folder on Views folder and name it as”ColumnChart”. Add a new View page in the “ColumnChart” folder as”Index.Cshtml”. Add this below code on Index.cshtml page
- <title>@ViewData["Title"] - Column Chart</title>
- <script type="text/javascript" src="https://www.gstatic.com/charts/loader.js"></script>
- <div id="chart_div"></div>
- <script type="text/javascript">
- google.charts.load('current', {
- packages: ['corechart', 'bar']
- });
- google.charts.setOnLoadCallback(LoadData);
- function LoadData() {
- $.ajax({
- url: 'ColumnChart/PopulationChart',
- dataType: "json",
- type: "GET",
- error: function(xhr, status, error) {
- var err = eval("(" + xhr.responseText + ")");
- toastr.error(err.message);
- },
- success: function(data) {
- PopulationChart(data);
- return false;
- }
- });
- return false;
- }
- function PopulationChart(data) {
- var dataArray = [
- ['City', '2020 Population', '2010 Population', '2000 Population', '1990 Population']
- ];
- $.each(data, function(i, item) {
- dataArray.push([item.cityName, item.populationYear2020, item.populationYear2010, item.populationYear2000, item.populationYear1990]);
- });
- var data = google.visualization.arrayToDataTable(dataArray);
- var options = {
- title: 'Population of Largest Cities of Odisha ',
- chartArea: {
- width: '50%'
- },
- colors: ['#b0120a', '#7b1fa2', '#ffab91', '#d95f02'],
- hAxis: {
- title: 'City',
- minValue: 0
- },
- vAxis: {
- title: 'Total Population'
- }
- };
- var chart = new google.visualization.ColumnChart(document.getElementById('chart_div'));
- chart.draw(data, options);
- return false;
- }
- </script>
Step 6 - Add a new menu
Edit the Views/Shared/_Layout page and a new menu, as “Column Chart” and add the below code,
- <div class="navbar-collapse collapse">
- <ul class="nav navbar-nav">
- <li><a asp-area="" asp-controller="Home" asp-action="Index">Home</a></li>
- <li><a asp-area="" asp-controller="Home" asp-action="About">About</a></li>
- <li><a asp-area="" asp-controller="Home" asp-action="Contact">Contact</a></li>
- <li><a asp-area="" asp-controller="StackedChart" asp-action="Index">Stacked Chart</a></li>
- <li><a asp-area="" asp-controller="ColumnChart" asp-action="Index">Column Chart</a></li>
- </ul>
- </div>
Step 7
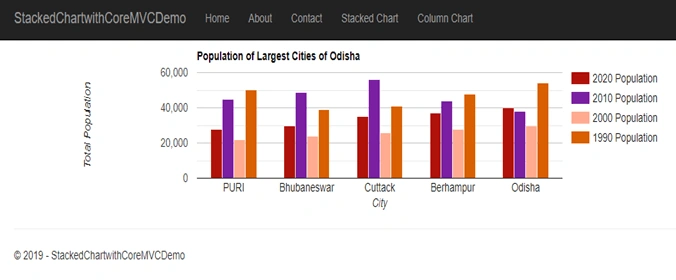
Now run the application and see the column chart as below.
Line Chart
Step 1
Add a new class to Model folder as “PopulationModel” and implement properties.
- namespace StackedChartwithCoreMVCDemo.Models
- {
- public class PopulationModel
- {
- public string CityName { get; set; }
- public int PopulationYear2020 { get; set; }
- public int PopulationYear2010 { get; set; }
- public int PopulationYear2000 { get; set; }
- public int PopulationYear1990 { get; set; }
- }
- }
Step 2
Add a new class to Model folder for data access and name it as “PopulationDataAccessaLayer” and implement the code.
- namespace StackedChartwithCoreMVCDemo.Models
- {
- public class PopulationDataAccessaLayer
- {
- public static List<PopulationModel> GetUsStatePopulationList()
- {
- var list = new List<PopulationModel>();
- list.Add(new PopulationModel { CityName = "Chennai", PopulationYear2020 = 28000, PopulationYear2010 = 15000, PopulationYear2000 = 22000, PopulationYear1990 = 50000 });
- list.Add(new PopulationModel { CityName = "Pune", PopulationYear2020 = 30000, PopulationYear2010 = 19000, PopulationYear2000 = 24000, PopulationYear1990 = 39000 });
- list.Add(new PopulationModel { CityName = "Kochi", PopulationYear2020 = 35000, PopulationYear2010 = 16000, PopulationYear2000 = 26000, PopulationYear1990 = 41000 });
- list.Add(new PopulationModel { CityName = "Kolkata", PopulationYear2020 = 37000, PopulationYear2010 = 14000, PopulationYear2000 = 28000 , PopulationYear1990 = 48000 });
- list.Add(new PopulationModel { CityName = "Odisha", PopulationYear2020 = 40000, PopulationYear2010 = 18000, PopulationYear2000 = 30000 , PopulationYear1990 = 54000 });
- return list;
- }
- }
- }
Step 3
Add a new controller to Controller folder and name it as “LineChart”.
And create a New Acton Result to display data in view and load line chart.
- using Microsoft.AspNetCore.Mvc;
- using StackedChartwithCoreMVCDemo.Models;
- // For more information on enabling MVC for empty projects, visit https://go.microsoft.com/fwlink/?LinkID=397860
- namespace StackedChartwithCoreMVCDemo.Controllers
- {
- public class LineChartController : Controller
- {
- // GET: /<controller>/
- public IActionResult Index()
- {
- return View();
- }
- [HttpGet]
- public JsonResult PopulationChart()
- {
- var populationList = PopulationDataAccessaLayer.GetCityPopulationList();
- return Json(populationList);
- }
- }
- }
Step 4
Add a new folder on Views folder and name it as "LineChart” and add a new view page on “LineChart” folder as”Index.Cshtml”. Add this below code on Index.cshtml page.
- <title>@ViewData["Title"] - Line Chart</title>
- <script type="text/javascript" src="https://www.gstatic.com/charts/loader.js"></script>
- <div id="chart_div"></div>
- <script type="text/javascript">
- google.charts.load('current', {
- packages: ['corechart', 'bar']
- });
- google.charts.setOnLoadCallback(LoadData);
- function LoadData() {
- $.ajax({
- url: 'LineChart/PopulationChart',
- dataType: "json",
- type: "GET",
- error: function(xhr, status, error) {
- var err = eval("(" + xhr.responseText + ")");
- toastr.error(err.message);
- },
- success: function(data) {
- PopulationChart(data);
- return false;
- }
- });
- return false;
- }
- function PopulationChart(data) {
- var dataArray = [
- ['City', '2020 Population', '2010 Population', '2000 Population', '1990 Population']
- ];
- $.each(data, function(i, item) {
- dataArray.push([item.cityName, item.populationYear2020, item.populationYear2010, item.populationYear2000, item.populationYear1990]);
- });
- var data = google.visualization.arrayToDataTable(dataArray);
- var options = {
- title: 'Population of Largest Cities of Odisha ',
- chartArea: {
- width: '50%'
- },
- colors: ['#b0120a', '#7b1fa2', '#ffab91', '#d95f02'],
- hAxis: {
- title: 'City',
- minValue: 0
- },
- vAxis: {
- title: 'Total Population'
- }
- };
- var chart = new google.visualization.LineChart(document.getElementById('chart_div'));
- chart.draw(data, options);
- return false;
- }
- </script>
Step 5 - Add a new menu
Edit the Views/Shared/_Layout page and a new menu, as “Line Chart” and add the below code.
- <div class="navbar-collapse collapse">
- <ul class="nav navbar-nav">
- <li><a asp-area="" asp-controller="Home" asp-action="Index">Home</a></li>
- <li><a asp-area="" asp-controller="Home" asp-action="About">About</a></li>
- <li><a asp-area="" asp-controller="Home" asp-action="Contact">Contact</a></li>
- <li><a asp-area="" asp-controller="StackedChart" asp-action="Index">Stacked Chart</a></li>
- <li><a asp-area="" asp-controller="LineChart" asp-action="Index">Line Chart</a></li>
- </ul>
Step 6
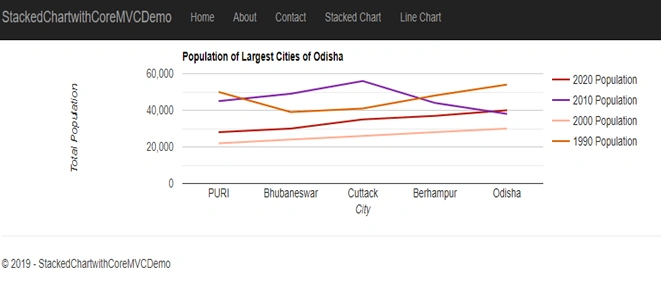
Now run the application and see the line chart as below.
Pie Chart
Step 1
Add a new class to Model folder as “PopulationModel” and implement properties.
- namespace StackedChartwithCoreMVCDemo.Models
- {
- public class PopulationModel
- {
- public string CityName { get; set; }
- public int PopulationYear2020 { get; set; }
- public int PopulationYear2010 { get; set; }
- public int PopulationYear2000 { get; set; }
- public int PopulationYear1990 { get; set; }
- }
- }
Step 2
Add new class to Model folder for data access and named as “PopulationDataAccessaLayer” and implement the code.
- namespace StackedChartwithCoreMVCDemo.Models
- {
- public class PopulationDataAccessaLayer
- {
- public static List<PopulationModel> GetUsStatePopulationList()
- {
- var list = new List<PopulationModel>();
- list.Add(new PopulationModel { CityName = "Chennai", PopulationYear2020 = 28000, PopulationYear2010 = 15000, PopulationYear2000 = 22000, PopulationYear1990 = 50000 });
- list.Add(new PopulationModel { CityName = "Pune", PopulationYear2020 = 30000, PopulationYear2010 = 19000, PopulationYear2000 = 24000, PopulationYear1990 = 39000 });
- list.Add(new PopulationModel { CityName = "Kochi", PopulationYear2020 = 35000, PopulationYear2010 = 16000, PopulationYear2000 = 26000, PopulationYear1990 = 41000 });
- list.Add(new PopulationModel { CityName = "Kolkata", PopulationYear2020 = 37000, PopulationYear2010 = 14000, PopulationYear2000 = 28000 , PopulationYear1990 = 48000 });
- list.Add(new PopulationModel { CityName = "Odisha", PopulationYear2020 = 40000, PopulationYear2010 = 18000, PopulationYear2000 = 30000 , PopulationYear1990 = 54000 });
- return list;
- }
- }
- }
Step 3
Add a new controller to Controller folder and name it as “PieChart”.
And create a New Acton Result to display data in view and load Pie chart.
- using Microsoft.AspNetCore.Mvc;
- using StackedChartwithCoreMVCDemo.Models;
- namespace StackedChartwithCoreMVCDemo.Controllers
- {
- public class PieChartController : Controller
- {
- // GET: /<controller>/
- public IActionResult Index()
- {
- return View();
- }
- [HttpGet]
- public JsonResult PopulationChart()
- {
- var populationList = PopulationDataAccessaLayer.GetCityPopulationList();
- return Json(populationList);
- }
- }
- }
Step 4
Add a new folder on Views folder and name it as”PieChart” and add a new view page on “PieChart” folder as”Index.Cshtml”. Add this below code on Index.cshtml page.
- <title>@ViewData["Title"] - Pie Chart</title>
- <script type="text/javascript" src="https://www.gstatic.com/charts/loader.js"></script>
- <div id="chart_div"></div>
- <script type="text/javascript">
- google.charts.load('current', {
- packages: ['corechart', 'bar']
- });
- google.charts.setOnLoadCallback(LoadData);
- function LoadData() {
- $.ajax({
- url: 'PieChart/PopulationChart',
- dataType: "json",
- type: "GET",
- error: function (xhr, status, error) {
- var err = eval("(" + xhr.responseText + ")");
- toastr.error(err.message);
- },
- success: function (data) {
- PopulationChart(data);
- return false;
- }
- });
- return false;
- }
- function PopulationChart(data) {
- var dataArray = [
- ['City', '2020 Population', '2010 Population', '2000 Population', '1990 Population']
- ];
- $.each(data, function (i, item) {
- dataArray.push([item.cityName, item.populationYear2020, item.populationYear2010, item.populationYear2000, item.populationYear1990]);
- });
- var data = google.visualization.arrayToDataTable(dataArray);
- var options = {
- title: 'Population of Largest Cities of Odisha ',
- chartArea: {
- width: '50%'
- },
- colors: ['#b0120a', '#7b1fa2', '#ffab91', '#d95f02'],
- hAxis: {
- title: 'City',
- minValue: 0
- },
- vAxis: {
- title: 'Total Population'
- }
- };
- var chart = new google.visualization.PieChart(document.getElementById('chart_div'));
- chart.draw(data, options);
- return false;
- }
- </script>
Step 5 - Add a new menu
Edit the Views/Shared/_Layout page and a new menu, as “Pie Chart” and add the below code.
- <div class="navbar-collapse collapse">
- <ul class="nav navbar-nav">
- <li><a asp-area="" asp-controller="Home" asp-action="Index">Home</a></li>
- <li><a asp-area="" asp-controller="Home" asp-action="About">About</a></li>
- <li><a asp-area="" asp-controller="Home" asp-action="Contact">Contact</a></li>
- <li><a asp-area="" asp-controller="StackedChart" asp-action="Index">Stacked Chart</a></li>
- <li><a asp-area="" asp-controller="PieChart" asp-action="Index">Pie Chart</a></li>
- </ul>
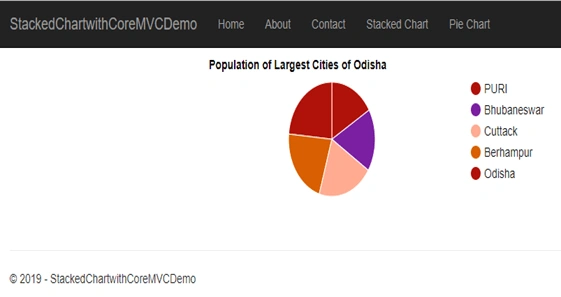
Step 6
Now run the application and see the line chart as below.
Area Chart
Step 1
Add a new class to Model folder as “PopulationModel” and implement properties.
- namespace StackedChartwithCoreMVCDemo.Models
- {
- public class PopulationModel
- {
- public string CityName { get; set; }
- public int PopulationYear2020 { get; set; }
- public int PopulationYear2010 { get; set; }
- public int PopulationYear2000 { get; set; }
- public int PopulationYear1990 { get; set; }
- }
- }
Step 2
Add new class to Model folder for data access and name it as “PopulationDataAccessaLayer” and implement the code.
- namespace StackedChartwithCoreMVCDemo.Models
- {
- public class PopulationDataAccessaLayer
- {
- public static List<PopulationModel> GetUsStatePopulationList()
- {
- var list = new List<PopulationModel>();
- list.Add(new PopulationModel { CityName = "Chennai", PopulationYear2020 = 28000, PopulationYear2010 = 15000, PopulationYear2000 = 22000, PopulationYear1990 = 50000 });
- list.Add(new PopulationModel { CityName = "Pune", PopulationYear2020 = 30000, PopulationYear2010 = 19000, PopulationYear2000 = 24000, PopulationYear1990 = 39000 });
- list.Add(new PopulationModel { CityName = "Kochi", PopulationYear2020 = 35000, PopulationYear2010 = 16000, PopulationYear2000 = 26000, PopulationYear1990 = 41000 });
- list.Add(new PopulationModel { CityName = "Kolkata", PopulationYear2020 = 37000, PopulationYear2010 = 14000, PopulationYear2000 = 28000 , PopulationYear1990 = 48000 });
- list.Add(new PopulationModel { CityName = "Odisha", PopulationYear2020 = 40000, PopulationYear2010 = 18000, PopulationYear2000 = 30000 , PopulationYear1990 = 54000 });
- return list;
- }
- }
- }
Step 3
Add a new controller to Controller folder and name it as “AreaChart”.
And create a New Acton Result to display data in view and load Area chart.
- using Microsoft.AspNetCore.Mvc;
- using StackedChartwithCoreMVCDemo.Models;
- namespace StackedChartwithCoreMVCDemo.Controllers
- {
- public class AreaChartController : Controller
- {
- // GET: /<controller>/
- public IActionResult Index()
- {
- return View();
- }
- [HttpGet]
- public JsonResult PopulationChart()
- {
- var populationList = PopulationDataAccessaLayer.GetCityPopulationList();
- return Json(populationList);
- }
- }
- }
Step 4
Add a new folder on Views folder and name it as”AreaChart” and add a new view page on “AreaChart” folder as”Index.Cshtml”. Add this below code on Index.cshtml page.
- <title>@ViewData["Title"] - Area Chart</title>
- <script type="text/javascript" src="https://www.gstatic.com/charts/loader.js"></script>
- <div id="chart_div"></div>
- <script type="text/javascript">
- google.charts.load('current', {
- packages: ['corechart', 'bar']
- });
- google.charts.setOnLoadCallback(LoadData);
- function LoadData() {
- $.ajax({
- url: 'AreaChart/PopulationChart',
- dataType: "json",
- type: "GET",
- error: function (xhr, status, error) {
- var err = eval("(" + xhr.responseText + ")");
- toastr.error(err.message);
- },
- success: function (data) {
- PopulationChart(data);
- return false;
- }
- });
- return false;
- }
- function PopulationChart(data) {
- var dataArray = [
- ['City', '2020 Population', '2010 Population', '2000 Population', '1990 Population']
- ];
- $.each(data, function (i, item) {
- dataArray.push([item.cityName, item.populationYear2020, item.populationYear2010, item.populationYear2000, item.populationYear1990]);
- });
- var data = google.visualization.arrayToDataTable(dataArray);
- var options = {
- title: 'Population of Largest Cities of Odisha ',
- chartArea: {
- width: '50%'
- },
- colors: ['#b0120a', '#7b1fa2', '#ffab91', '#d95f02'],
- hAxis: {
- title: 'City',
- minValue: 0
- },
- vAxis: {
- title: 'Total Population'
- }
- };
- var chart = new google.visualization.AreaChart(document.getElementById('chart_div'));
- chart.draw(data, options);
- return false;
- }
- </script>
Step 5 - Add a new menu
Edit the Views/Shared/_Layout page and a new menu, as “Area Chart” and add the below code.
- <div class="navbar-collapse collapse">
- <ul class="nav navbar-nav">
- <li><a asp-area="" asp-controller="Home" asp-action="Index">Home</a></li>
- <li><a asp-area="" asp-controller="Home" asp-action="About">About</a></li>
- <li><a asp-area="" asp-controller="Home" asp-action="Contact">Contact</a></li>
- <li><a asp-area="" asp-controller="StackedChart" asp-action="Index">Stacked Chart</a></li>
- <li><a asp-area="" asp-controller="AreaChart" asp-action="Index">Area Chart</a></li>
- </ul>
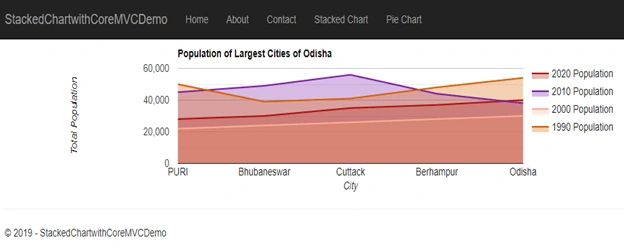
Step 6
Now run the application and see the Area chart as below.
Bar Chart
Step 1
Add a new class to Model folder as “PopulationModel” and implement properties.
- namespace StackedChartwithCoreMVCDemo.Models
- {
- public class PopulationModel
- {
- public string CityName { get; set; }
- public int PopulationYear2020 { get; set; }
- public int PopulationYear2010 { get; set; }
- public int PopulationYear2000 { get; set; }
- public int PopulationYear1990 { get; set; }
- }
- }
Step 2
Add new class to Model folder for data access and name it as “PopulationDataAccessaLayer” and implement the code.
- namespace StackedChartwithCoreMVCDemo.Models
- {
- public class PopulationDataAccessaLayer
- {
- public static List<PopulationModel> GetUsStatePopulationList()
- {
- var list = new List<PopulationModel>();
- list.Add(new PopulationModel { CityName = "Chennai", PopulationYear2020 = 28000, PopulationYear2010 = 15000, PopulationYear2000 = 22000, PopulationYear1990 = 50000 });
- list.Add(new PopulationModel { CityName = "Pune", PopulationYear2020 = 30000, PopulationYear2010 = 19000, PopulationYear2000 = 24000, PopulationYear1990 = 39000 });
- list.Add(new PopulationModel { CityName = "Kochi", PopulationYear2020 = 35000, PopulationYear2010 = 16000, PopulationYear2000 = 26000, PopulationYear1990 = 41000 });
- list.Add(new PopulationModel { CityName = "Kolkata", PopulationYear2020 = 37000, PopulationYear2010 = 14000, PopulationYear2000 = 28000 , PopulationYear1990 = 48000 });
- list.Add(new PopulationModel { CityName = "Odisha", PopulationYear2020 = 40000, PopulationYear2010 = 18000, PopulationYear2000 = 30000 , PopulationYear1990 = 54000 });
- return list;
- }
- }
- }
Step 3
Add a new controller to Controller folder and name it as “BarChart”.
And create a New Acton Result to display data in view and load Area chart.
- using Microsoft.AspNetCore.Mvc;
- using StackedChartwithCoreMVCDemo.Models;
- namespace StackedChartwithCoreMVCDemo.Controllers
- {
- public class BarChartController : Controller
- {
- // GET: /<controller>/
- public IActionResult Index()
- {
- return View();
- }
- [HttpGet]
- public JsonResult PopulationChart()
- {
- var populationList = PopulationDataAccessaLayer.GetCityPopulationList();
- return Json(populationList);
- }
- }
- }
Step 4
Add a new folder on Views folder and name it as”BarChart” and add a new view page on “BarChart” folder as”Index.Cshtml”. Add this below code on Index.cshtml page.
- <title>@ViewData["Title"] - Bar Chart</title>
- <script type="text/javascript" src="https://www.gstatic.com/charts/loader.js"></script>
- <div id="chart_div"></div>
- <script type="text/javascript">
- google.charts.load('current', {
- packages: ['corechart', 'bar']
- });
- google.charts.setOnLoadCallback(LoadData);
- function LoadData() {
- $.ajax({
- url: 'BarChart/PopulationChart',
- dataType: "json",
- type: "GET",
- error: function (xhr, status, error) {
- var err = eval("(" + xhr.responseText + ")");
- toastr.error(err.message);
- },
- success: function (data) {
- PopulationChart(data);
- return false;
- }
- });
- return false;
- }
- function PopulationChart(data) {
- var dataArray = [
- ['City', '2020 Population', '2010 Population', '2000 Population', '1990 Population']
- ];
- $.each(data, function (i, item) {
- dataArray.push([item.cityName, item.populationYear2020, item.populationYear2010, item.populationYear2000, item.populationYear1990]);
- });
- var data = google.visualization.arrayToDataTable(dataArray);
- var options = {
- title: 'Population of Largest Cities of Odisha ',
- chartArea: {
- width: '50%'
- },
- colors: ['#b0120a', '#7b1fa2', '#ffab91', '#d95f02'],
- hAxis: {
- title: 'City',
- minValue: 0
- },
- vAxis: {
- title: 'Total Population'
- }
- };
- var chart = new google.visualization.BarChart(document.getElementById('chart_div'));
- chart.draw(data, options);
- return false;
- }
- </script>
Step 5 - Add a new menu
Edit the Views/Shared/_Layout page and a new menu, as “Area Chart” and add the below code.
- <div class="navbar-collapse collapse">
- <ul class="nav navbar-nav">
- <li><a asp-area="" asp-controller="Home" asp-action="Index">Home</a></li>
- <li><a asp-area="" asp-controller="Home" asp-action="About">About</a></li>
- <li><a asp-area="" asp-controller="Home" asp-action="Contact">Contact</a></li>
- <li><a asp-area="" asp-controller="StackedChart" asp-action="Index">Stacked Chart</a></li>
- <li><a asp-area="" asp-controller="BarChart" asp-action="Index">Bar Chart</a></li>
- </ul>
- </div>
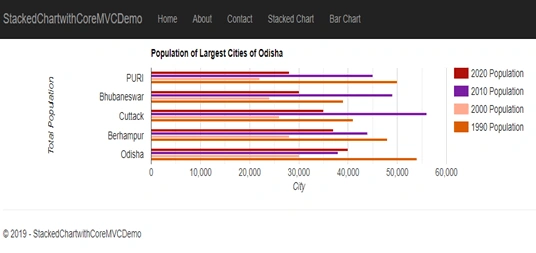
Step 6
Now run the application and see the Area chart as below.
Raffi MansoorPosted Aug 24, 2019, 4:21 AM
Hello sir, i am using your stacked chart it was awesome .but i have some problems.My Problem is i dont know the exact count of y axis.In your example (list.Add(new PopulationModel { CityName = "Chennai", PopulationYear2020 = 28000, PopulationYear2010 = 15000, PopulationYear2000 = 22000, PopulationYear1990 = 50000 }); ) Cityname is constant but i dont know the count of y axis i.e run time only i know the count of population class properties is it is possible to create this chart like this ?