

Introduction
Data model is a powerful feature of Power BI. Data Modeling is used to connect multiple data sources using a relationship. A relationship shows how these data sources are connected together. Through data modeling, you can create an interesting visualization and reports.
To start data modeling, we will first create a relationship. We can also create a calculated column, create a required visualization of data and much more.
Let’s start this article. Below are the steps to create a relationship between two tables.
Step 1
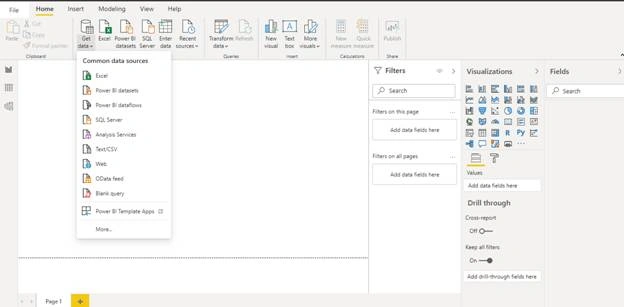
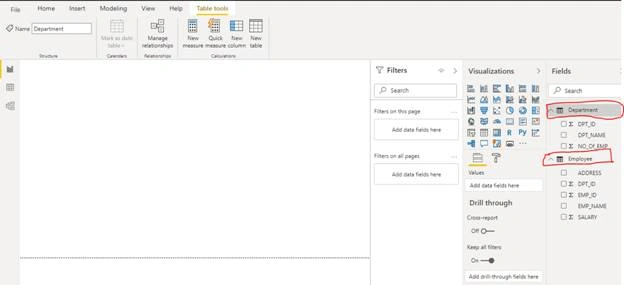
Here we have two csv files for Employee and Department. So first I am going to import data from these two sources into the Power BI by clicking on ‘Get data’ and select ‘Text/CSV’ from the ‘Home’ tab.
Step 2
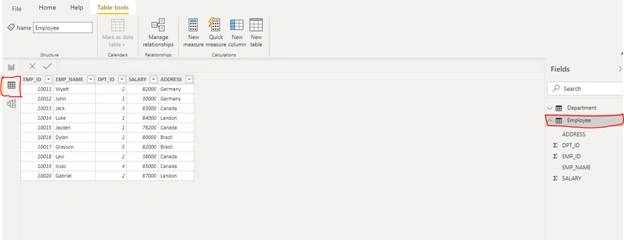
At the right side of the BI tool there are three symbols for ‘Report’, ‘Data’ and ‘Model’. While you click Report you can see the visual of the table in multiple visualization chart. By clicking on ‘Data’ symbol you can check the data of the selected table.
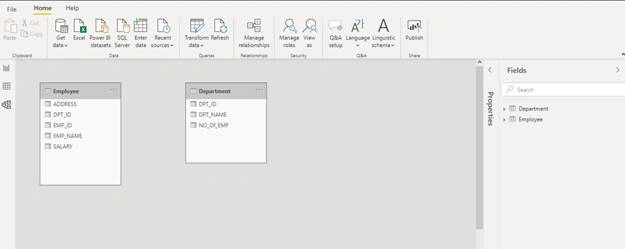
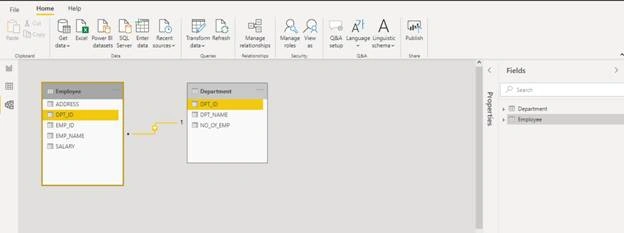
Third symbol is ‘Model’, here you can create a relationship between the tables. While you click on ‘Model’ you can see all existing tables.
Step 3
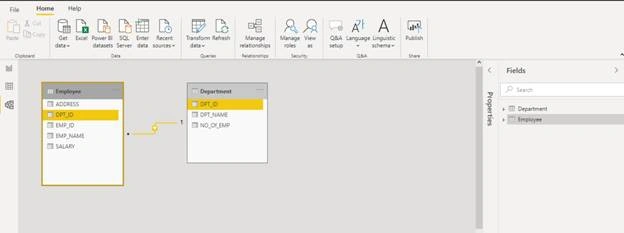
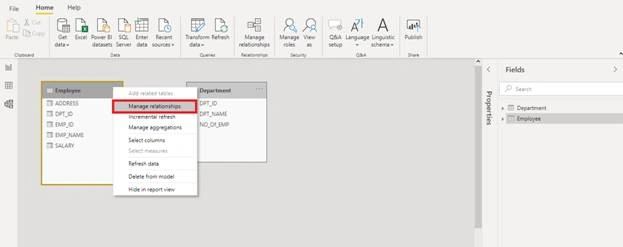
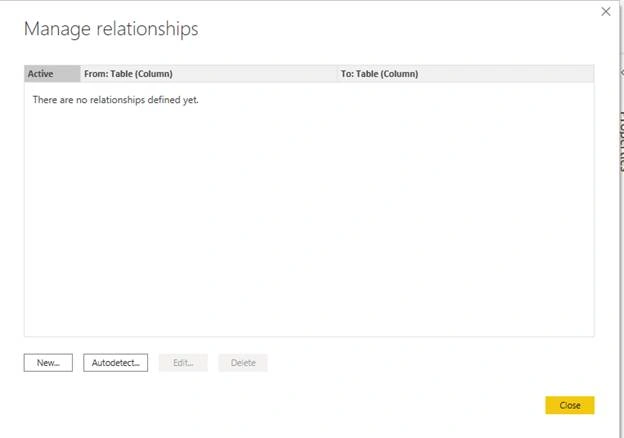
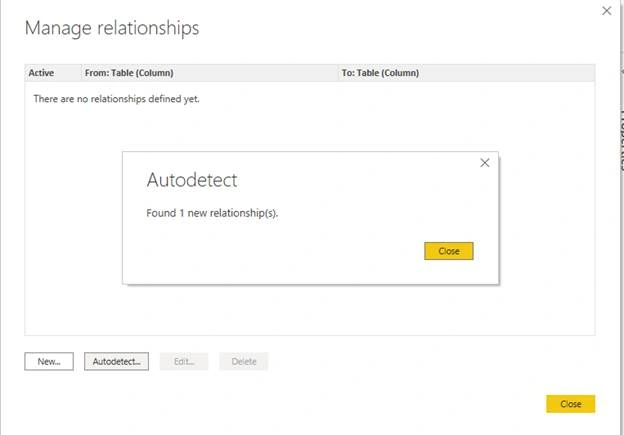
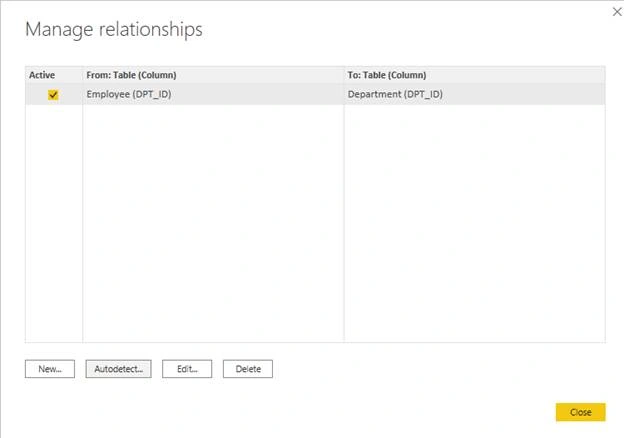
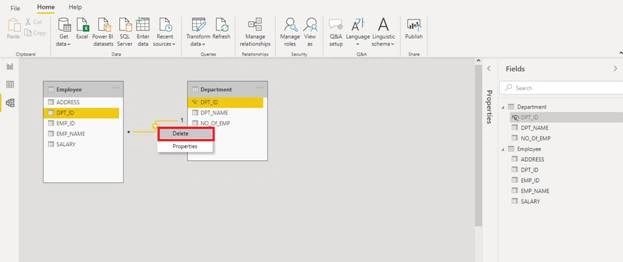
Here we will create a relationship between these two tables i.e. ‘Employee’ and ‘Department’. We have two ways to do this.
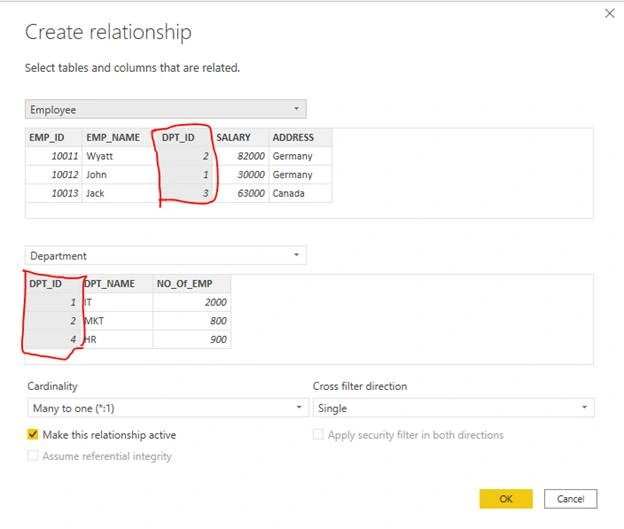
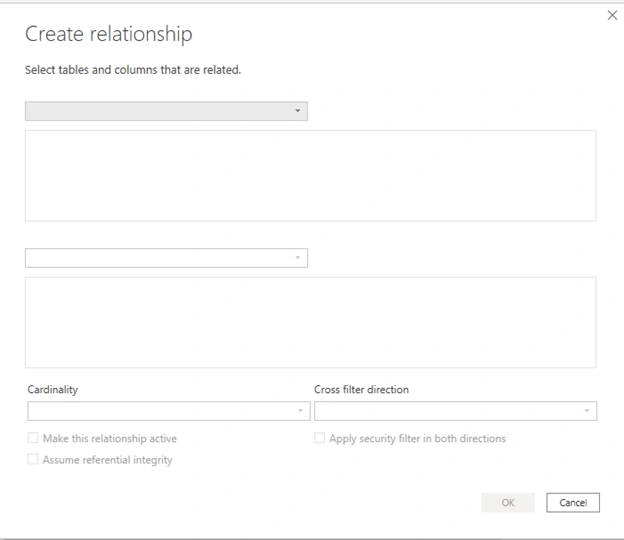
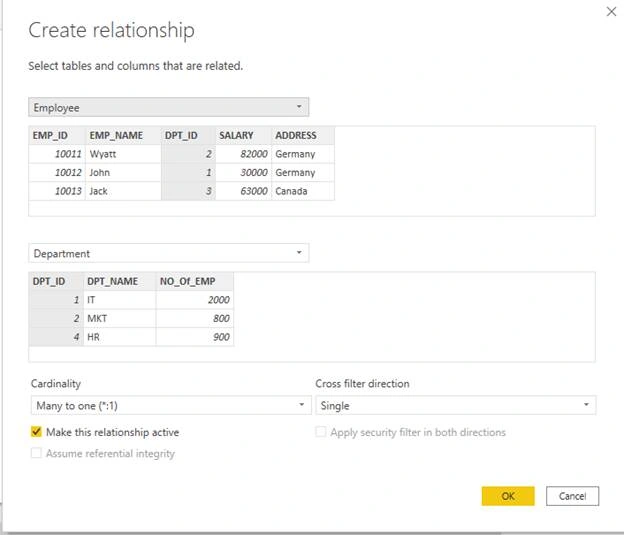
- Just drag the common column from one table to another. In our case the DPT_ID is the common column through which we can join our table. Now drag the ‘DPT_ID’ from employee table to ‘Department’. A new window ‘Create Relationship’ will be opened. Now click on ‘Ok’.
Join the conversation! Your thoughts help the community grow.