

As Power BI continues to mature as an enterprise analytics platform, Microsoft has been steadily closing the gap between report authors and analytics engineers. One of the most impactful additions in recent releases is DAX Query View in Power BI Desktop.
DAX Query View brings a long-requested capability directly into the Power BI authoring experience: the ability to write, run, and analyze DAX queries against your semantic model without leaving Power BI Desktop. For anyone serious about DAX, performance tuning, or model validation, this feature is a game-changer.
What Is DAX Query View?
DAX Query View is a dedicated workspace inside Power BI Desktop that allows you to:
Write DAX queries using
EVALUATE,DEFINE, andVARExecute queries directly against the current semantic model
Inspect query results in a tabular format
Unlike measures, which must return a single scalar value, DAX queries can return entire tables, making them ideal for exploration, debugging, and validation.
Why DAX Query View Is So Useful
1. Explore Your Data Without Creating Visuals
Before DAX Query View, validating logic often meant creating temporary tables or visuals just to inspect data. With DAX Query View, you can:
Query tables directly
Filter, summarize, or reshape data on the fly
Quickly understand how your model behaves under different contexts
This significantly speeds up data exploration and model validation.
2. Debug and Validate Complex DAX Logic
When a measure produces unexpected results, DAX Query View allows you to:
Break down calculations step by step
Test intermediate logic using variables
Inspect filter context explicitly
This makes it far easier to understand why a measure behaves a certain way, rather than guessing from visuals alone.
3. Performance Analysis and Optimization
DAX Query View integrates with performance tools, making it a powerful companion for optimization:
Test alternative DAX patterns and compare results
Validate aggregation logic before committing it to a measure
Identify inefficient filters or unnecessary calculations early
This is especially valuable in large models where small inefficiencies can have a noticeable impact.
4. A Familiar Experience for Advanced Users
For users coming from tools like SQL Server Management Studio (SSMS) or DAX Studio, DAX Query View feels immediately familiar:
Code-first editing experience
Clear separation between queries and measures
Readable, structured DAX syntax
It brings advanced analytical workflows directly into Power BI Desktop, reducing the need to switch tools.
How DAX Query View Fits into the Power BI Workflow
DAX Query View doesn’t replace measures or visuals—it complements them.
A typical workflow might look like this:
Explore and validate logic in DAX Query View
Refine and optimize the calculation
Convert the final logic into a reusable measure
Use the measure confidently in reports
This leads to cleaner models, better-performing reports, and fewer surprises during deployment.
How to Evaluate DAX Measure in the DAX Query View
Ensure you have already created your DAX measures
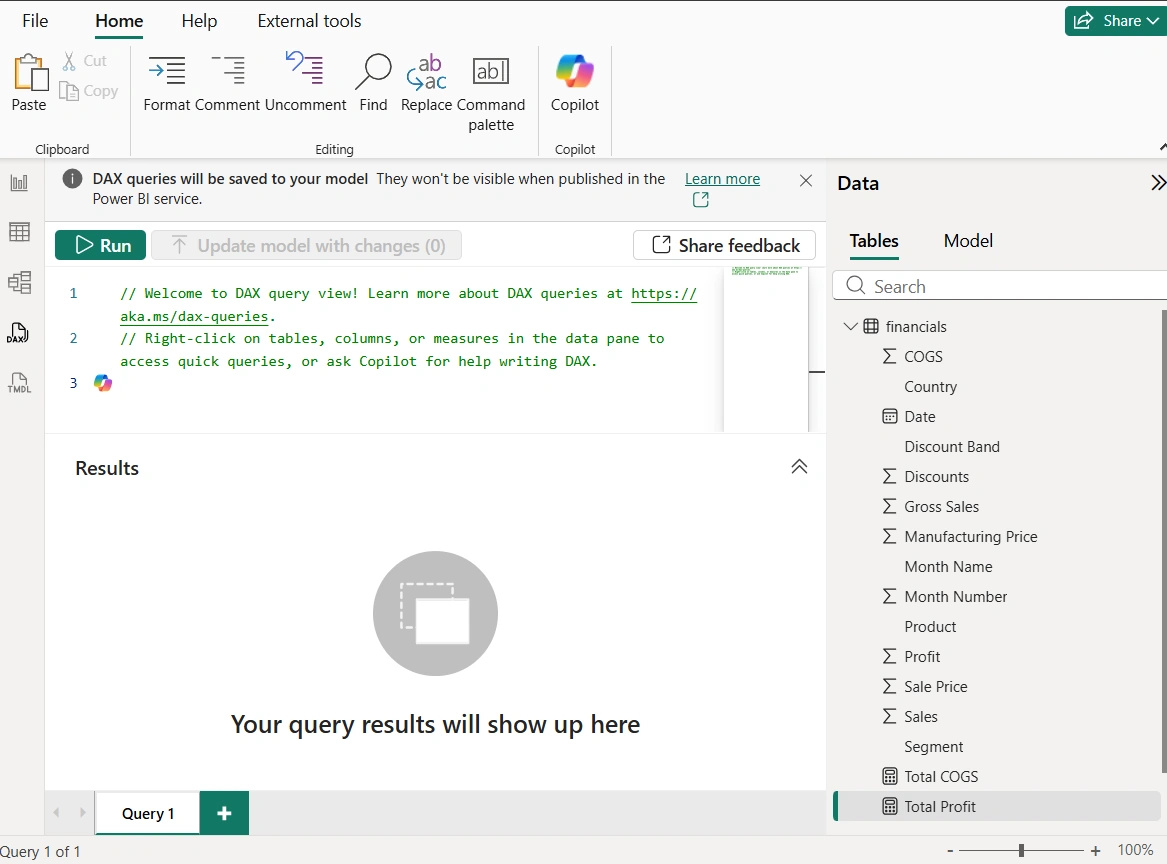
Switch to DAX query view as seen below
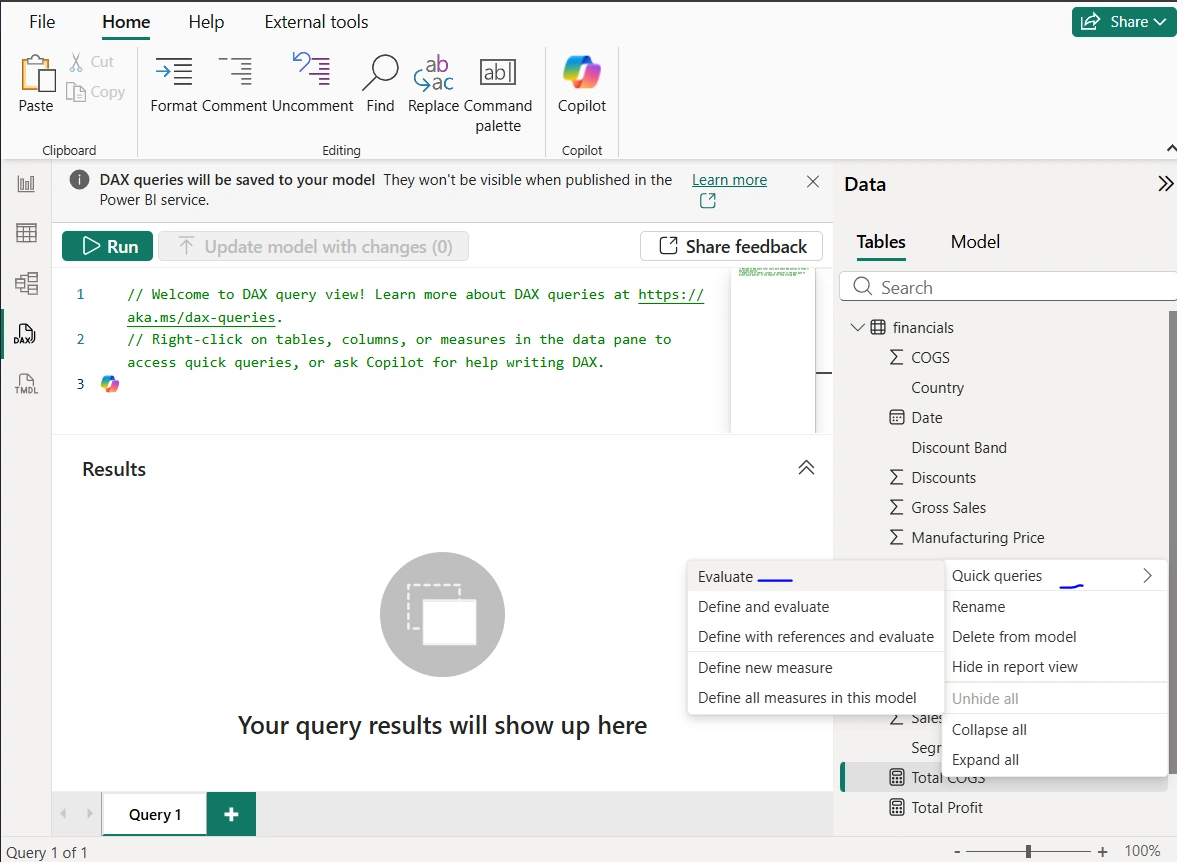
To evaluate the Total COGS measure as seen below:
Right-click -> Quick Queries-> Evaluate
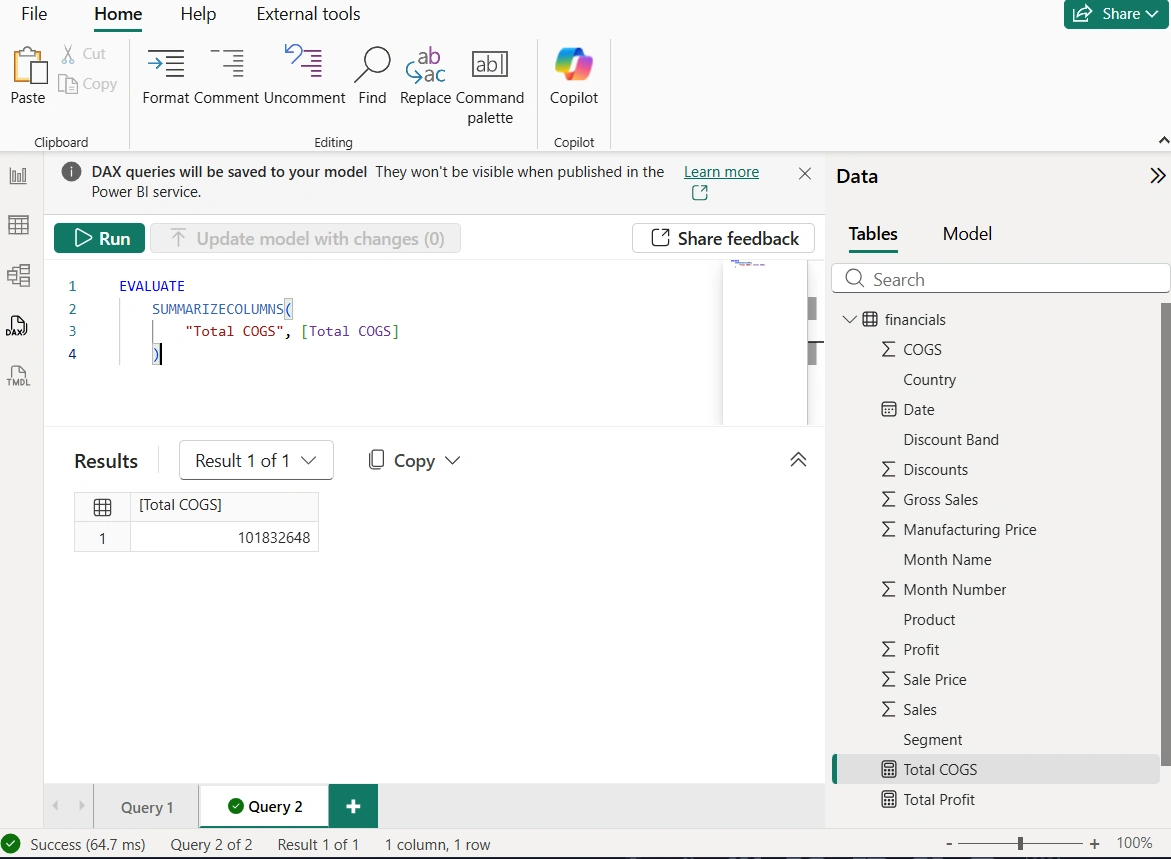
As seen below, the DAX measure is evaluated and the result of the Total COGS was also returned as a scalar value
How to Create DAX Measures in the DAX Query View
To create DAX measures in the DAX query view:
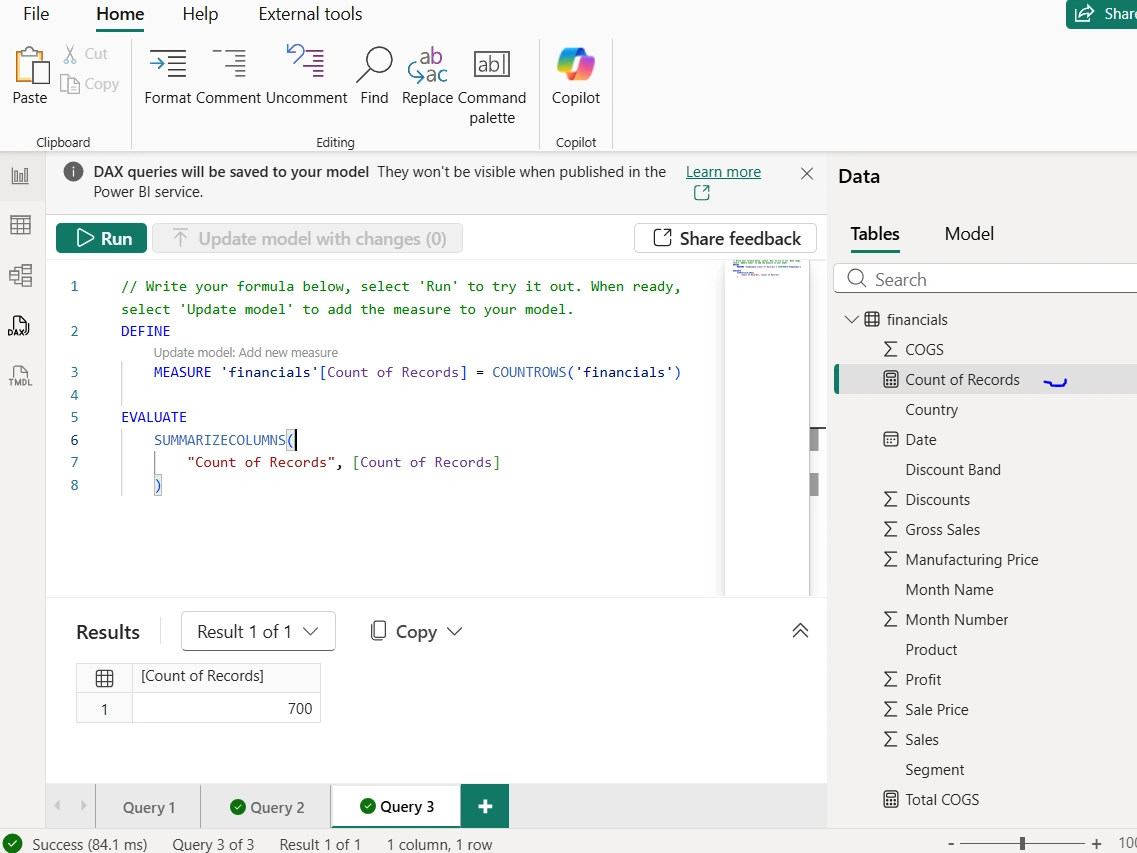
Define the measure as seen below. In the measure, we used countrows DAX function to count the rows in the financials table. Simultaneously, we used the Evaluate function combined with SUMMARIZECOLUMNS DAX function to display the defined measure.
After that, I clicked Run and there we have the result of 700
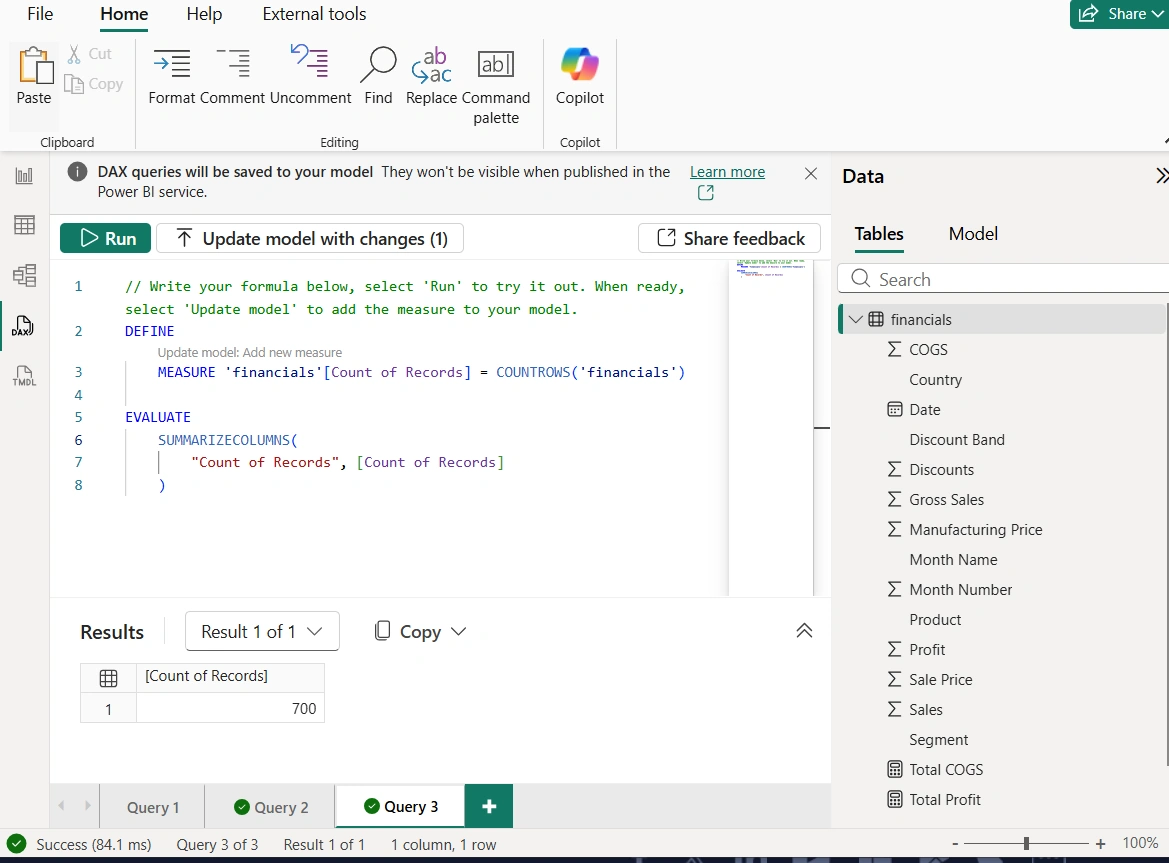
To include the define measure in the data model, we clicked on the Update model: Add new measure button
As seen in the screenshot below, the Count of Records new measure in now added to the data model
Final Thoughts
DAX Query View represents a major step forward in Power BI’s evolution toward a true analytics engineering platform. It empowers users to understand their data models at a deeper level, write better DAX, and build more reliable reports.
For report authors, it removes guesswork.
For data modelers, it provides precision.
For advanced users, it finally brings first-class DAX querying into Power BI Desktop.
If you work seriously with DAX, DAX Query View is not optional—it’s essential.
Join the conversation! Your thoughts help the community grow.