

Hi guys. I am back with some new features of debugging and diagnostics enhancements in Visual Studio 2015. In the previous articles we learned about some new features of C# 6.0. If you want to learn about those new features of C# 6.0 also then read my previous articles.
So let's start with debugging options in Visual Studio 2015.
In Visual Studio 2015 we have many options for debugging with some new options that we will learn about in this article.
- PrefTips.
- Configuring Breakpoints.
- Conditions
- Actions
- Debugging and testing lambda expressions in Watch windows.
- Run to the Cursor.
So let's see how to use all of them one by one with examples.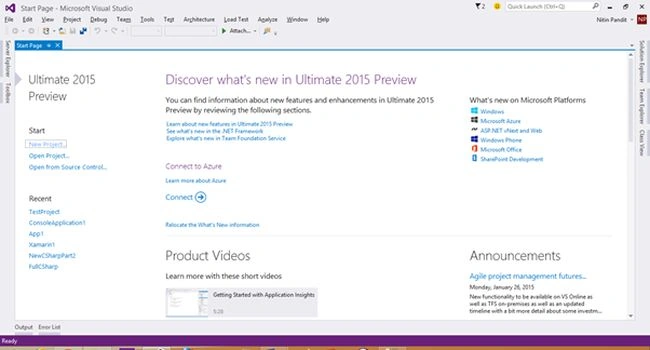
1. PrefTips
PerfTips (tooltips with performance information) is a new technique for debugging in Visual Studio 2015 in which we can test the elapsed time between the current breakpoint and the break that occurred last. By PerfTips we can see how long the program was running during the previous step or since the last breakpoint. So let's see with an example by creating a project in Visual Studio 2015.
"File" -> "New" -> "Project..."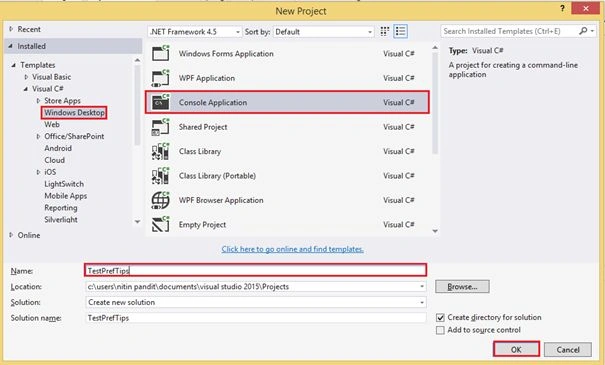
Now create a program where we can check elapsed time by PerfTips.
We need to calculate the elapsed time between the two lines of execution.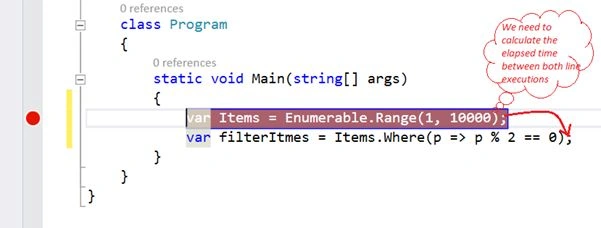
When we'll be run the code so after the break point it'll show the elapsed time.
That will show the time in MS (mile seconds).
When we right-click on that time it'll show the PerfTips options to configure that.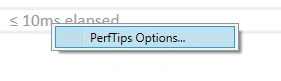
There is also a new option to show the CPU consumption time with PerfTips by clicking on that check box.
Now see the CPU consumption with elapsed time so now enjoy that behaviour of the new Visual Studio.
2. Configuring Breakpoints
Configuring Breakpoints is a new concept to configure a breakpoint setting to enable and disable breakpoints on a specified situation like if we need to write program code in C# or VB by two ways.
- Conditions
- Actions
Conditions
In conditions we can use breakpoints for 3 types of conditions. Let's see an example of all of them. So write a program first to check them.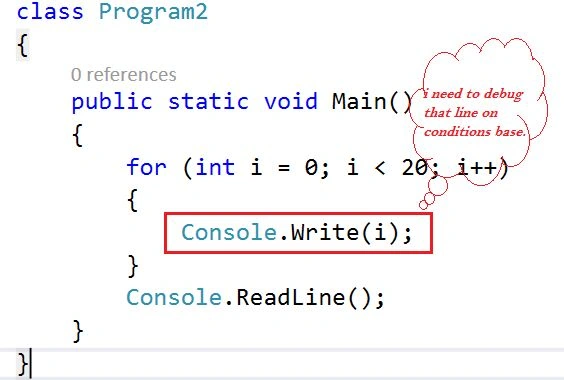
In Visual Studio 2015 when we need to use a break point then it'll show two options, the first for setting and Enabling or Disabling breakpoints.
Conditional statements break only when conditions you specify are met. Think of this as adding an “if” statement to your code and placing the breakpoint inside the “if” statement so it is only hit when the conditions you entered are true.
Add a new breakpoint first and click on the setting option and then it'll show a Breakpoint setting windows where we must select the Conditions check box and use that.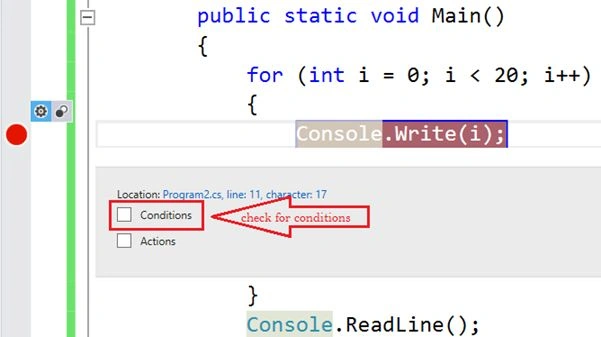
Where we need to select a Conditional Expression and also write that condition on the breakpoints we need to activate for debugging that code usiing the F11 key. 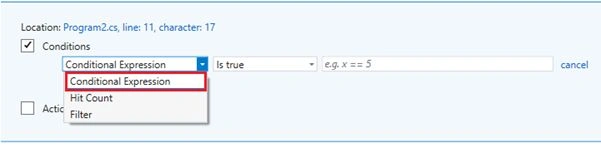
In the last TextBox you need to write the condition and in the condition you can use the local variable of the selected line in which breakpoints are placed and press Enter to submit the condition.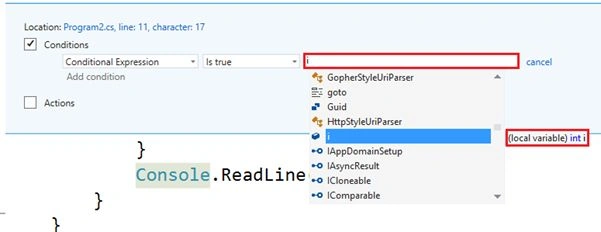
After submitting the condition you can see two options, the first to delete the previous condition and the next for adding a new condition again.
Now run the program by F5 or Crtl+F5 and the program will run but when the condition returns true then the breakpoint will activate. Now use F11 to debug line by line from where the condition will return true.
You can see the output too until the condition returns false the program is running without debugging. So it's very useful for a developer to save time debugging with that behaviour.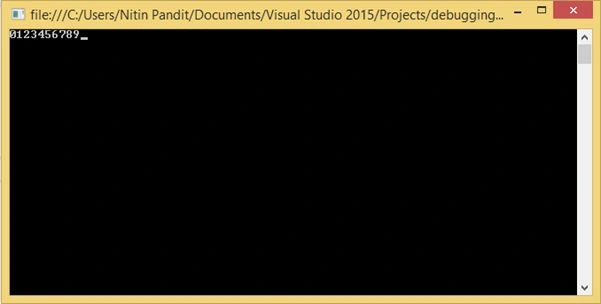
Hit counts break only after the breakpoint has been hit a certain number of times. These are useful in situations where code is called multiple times and you either know the exactly when it is failing, or have a general idea that “it fails after at least” a certain number of times. It's very usefull in the case where we want to trace the execution of code by a number of hits by the debugging engine to the selected line of code. So let's see how to use that.
Add a new breakpoint and go to the settings for the breakpoint as in the last example and select Hit Count from the Conditions options.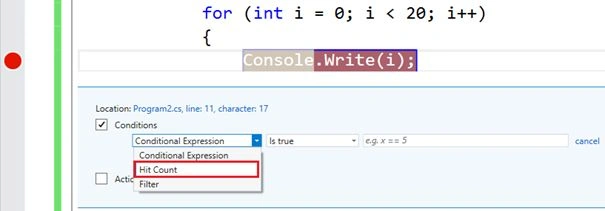
In the next option select the type of operator like (=, >=, is a multiple of) and in the next field enter the number of hits for the condition. 
After submitting the condition you can see the following in the breakpoint settings window.
Now run the program and the condition returns true for the number entered by you for the submitting condition. Now enjoy the Hit Count option.
Filters break when the breakpoint is hit on a specific thread, process, or machine and are useful for debugging code running in parallel.
For using the Filters option just add a new breakpoint on a selected line of code and go to the settings option for the breakpoint and select Filter from the conditions.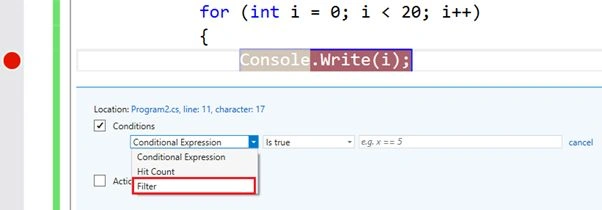
Now write a condition in the next TextBox from where we need to compare and check a process or any other thread by ThreadId or ThreadName that you want and enjoy that new option.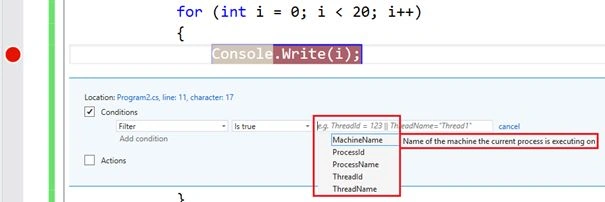
Actions is a new concept in Visual Studio 2015 by which we can trace a selected expression and also use a local variable's value for print a message or anything that you want. Basically it's a way to call an action on a specified expression like trace the changes in expression variables value for every time of hitting by the debugger engine. So let's have an example to print the value onto the Output window of a variable that is changed by an expression. Let's have an example.

Add a new breakpoint for an expression for a trace and go to the settings of the breakpoint and select Action now.

Write a message to be printed at the time of debugging in the output window and you can use the value of a local variable value in the message.

Finally submit the message and run the project.
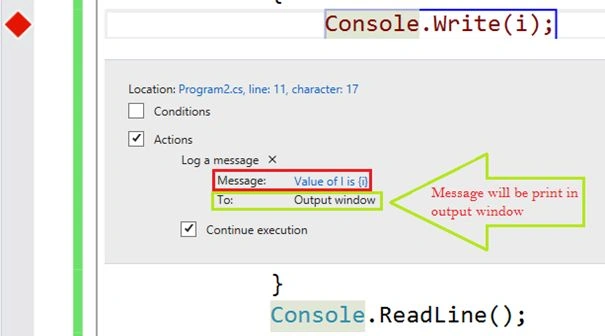
When the code with the selected line hits 10 times by the debugger it'll print the message into the output window 10 times so let's see the output window.

Now see the new thing if we want to activate this Action on a specified Condition we can use both properties of the Breakpoint Setting window (Action on Condition) so go to the settings option of the previous Breakpoint and select both and add a Condition too.

So let's see the output window at the of debugging my condition. It will return true only once when (i==10) so at that time the Action will call that message.

So now enjoy Conditions and Actions in your debugging state and save time and enjoy your code.
3. Debug and test lambda expressions in Watch windows
Everyone who uses LINQ (or lambdas in general) and the debugger will quickly discover the dreaded message “Expression cannot contain lambda expressions”. A lack of lambda support has been a limitation of the Visual Studio Debugger ever since Lambdas were added to C# and Visual Basic. We've heard your feedback and we are pleased to announce that the debugger now supports evaluation of lambda expressions!
Let's have an example of lambda expressions in a watch window with Visual Studio 2012 that shows an error in the case of lambda expressions.
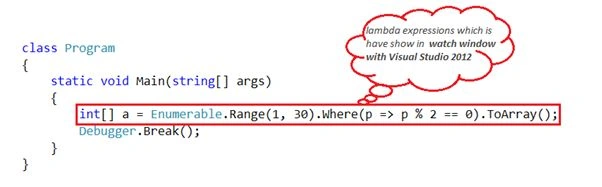
Now run the program that will stop on the Debugger.Break() function, then we can add a watch on the selected lambda expressions.
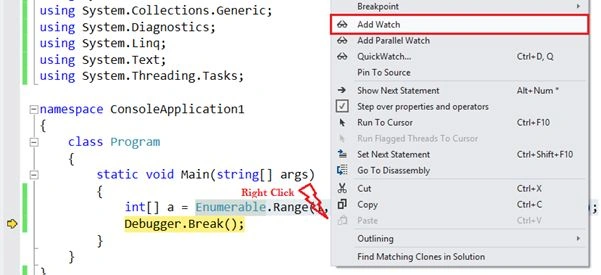
Now see in the watch window it will show the error “Expression cannot contain lambda expressions” on Watch Windows in Visual Studio until 2012.

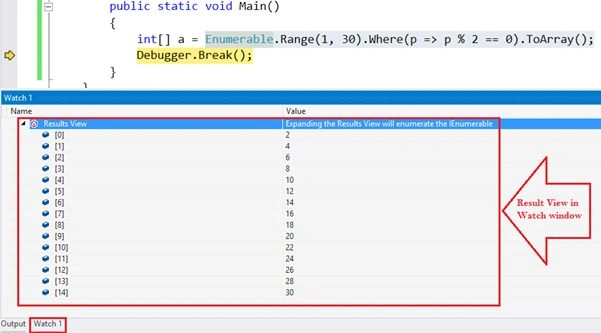
Let's do the same task in Visual Studio 2015, write the same code and run with a watch window and the effect.

Now run the program as the same previous program in Visual Studio 2012 that will be stop on teh Debugger.Break() function then we can add a watch on the selected lambda expressions in Visual Studio 2015.
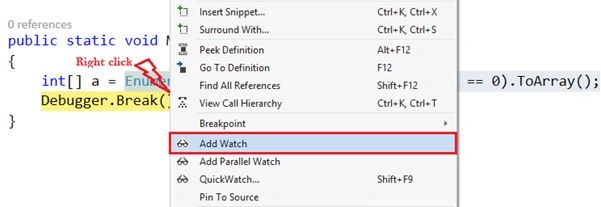
So now you can see the result in the watch windows also of lambda expressions so in the Visual Studio 2015 it's very easy to debug my lambda expressions so enjoy that new feature.
4. “Run to the Cursor” in Visual Studio
“Run To Cursor” is an alternative option of Breakpoints. Basically it's not a new feature of Visual Studio 2015 but most developers have never used that option that's way use that option also with all new debugging options, we can use that option to debug source code without breakpoints from where you want to debug line by line, by the “Run To Cursor” we can save the time of debugging, we can run directly to the line that we need to test by debugging and no need to start debugging by Visual Studio. Try it, it must be useful for every developer. Let's see how to use “Run To Cursor”.
Step 1: Open Visual Studio then select "File" -> "New" -> "Project...".

And write a class MyMath with a function named Sum(int Value1, int Value2) that we need in Main() and we need to debug from that line without breakpoints.
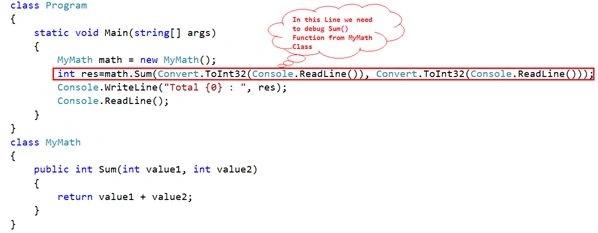
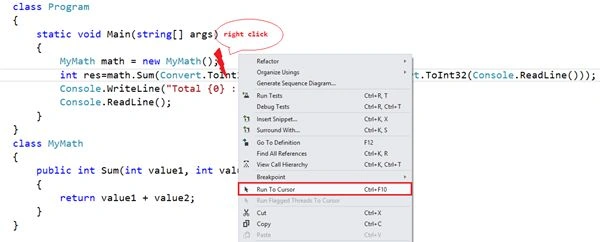
Now right-click on that line from we need to start Debugging and go to “Run to Cursor”.
And then my output will be as in the following code.
Now enter two value and press Enter and for next press F11 so we can debug line by line without breakpoints.

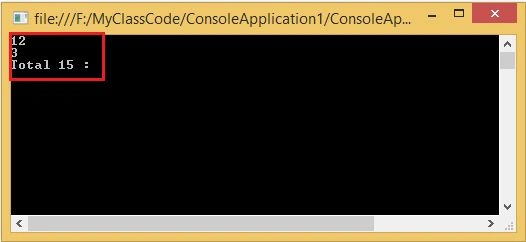
Now you can see the output.
I am very happy to share all debugging and diagnostic enhancements in Visual Studio 2015 with you, my dear friends. I hope you will enjoy, thanks.
Sr KarthigaPosted Feb 19, 2016, 6:01 AM
Nice Explanation
Yashwanth MuthineniPosted Aug 14, 2015, 5:24 AM
Nice share..thank you ...
Prasham SabadraPosted Feb 26, 2015, 5:36 PM
Thanks!
Humayun Kabir MamunPosted Jan 29, 2015, 5:31 AM
Nice...
Gaurav Kumar AroraPosted Jan 27, 2015, 7:54 AM
Nitin Pandit - nice explanation. Just one think regarding CPU consumption, I am thinking a a scenario for complex labdas or LINQ where we are DEBUGING and pause for a while is it a condition of hault or it will still count CPU consumption. In previous version when we extract list of our LINQ complex queries Enumerable things then after list object got null. If this is the same case with current version then what is the accuracy of CPU Consumption. Just a thought, might be need some R&D. One more thing it would be nice if you'll update contents with remote debugging feature as suggested by Veena Sarda mam
Rizwan AliPosted Jan 27, 2015, 4:30 AM
wow what a nice explanation with easy shots...!!!!!
Veena SardaPosted Jan 26, 2015, 8:54 AM
Good One ... One more great feature is remote debugging. The Visual Studio Remote Tools lets you run, debug, and test an application that is running on one device from another computer that is running Visual Studio.
Dinesh BeniwalPosted Jan 26, 2015, 7:48 AM
Great work.