

Introduction
In this article, we will learn how to debug an Angular 11 application in Visual Studio code.
Step 1 - What is Debugging?
Debugging is key to building any application.
Using the debugger in any file on our codebase will cause the application to break at the point where the statement is set. There are a few things we could do to avoid creating bugs from a developer's point of view.
Example:
Defensive Programming or Test-Driven Development.
Debugging an application is a key skill for developers, and speeds up the process of remove bugs and delivering the application.
How to debug Angular in Visual studio code (short note)
- Create an Angular application
- Click on Extension then Install Debugger for Chrome
- Configure Debug port in Environment
- Add a pointer
- Start Debugging
Step 2 - How to Install the Debugger for Chrome extension in VS Code
In Header navigation, click on the View Open Extension menu in Visual Studio Code:
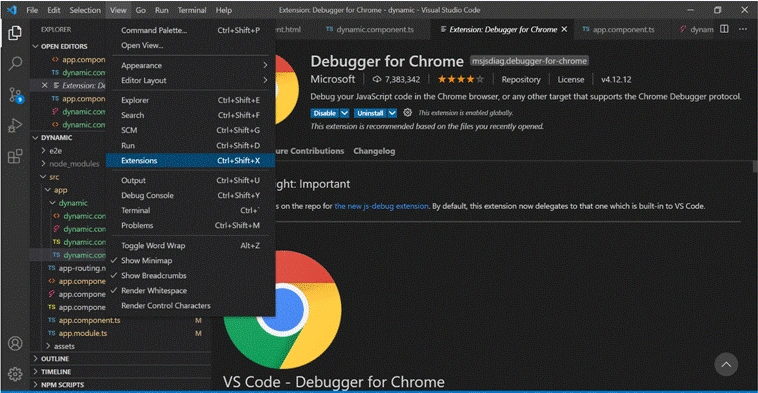
Or directly click on sidenavabar extension (ctrl+shift+X) then search the debugger for chrome and install the extension.
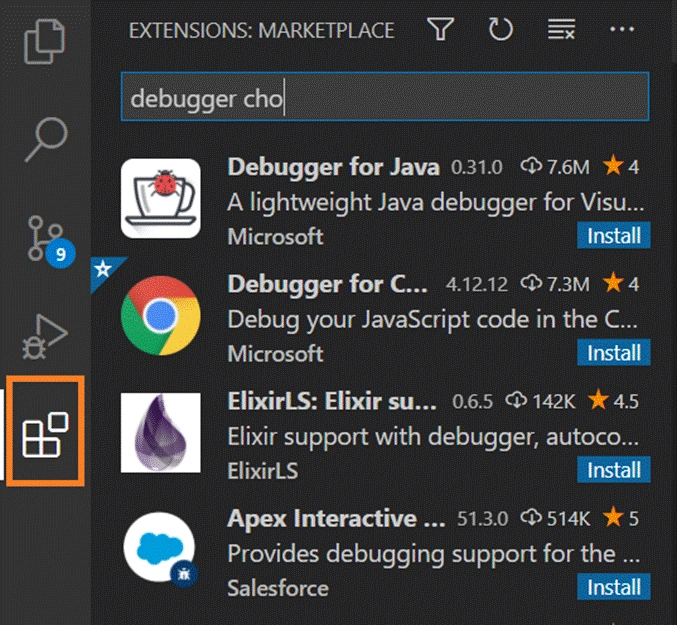
Step 3
This extension is provided by Microsoft
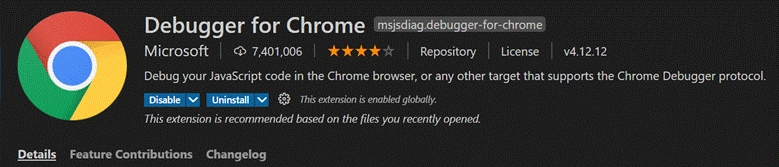
Create a launch.json config file
The launch.json file should look like this, with values changed to reflect your environment,
Set the angular port in the URL
- {
- "version": "0.2.0",
- "configurations": [
- {
- "type": "pwa-chrome",
- "request": "launch",
- "name": "Launch Chrome against localhost",
- "url": "http://localhost:1234",
- "webRoot": "${workspaceFolder}"
- }
- ]
- }
Step 4
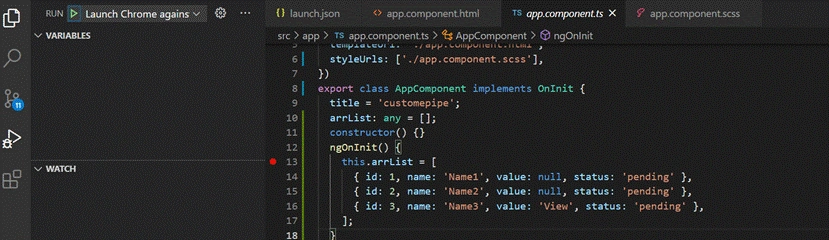
Now we can see a Debugger button in the left sidebar of vscode. Select Chrome as the environment.
Step 5
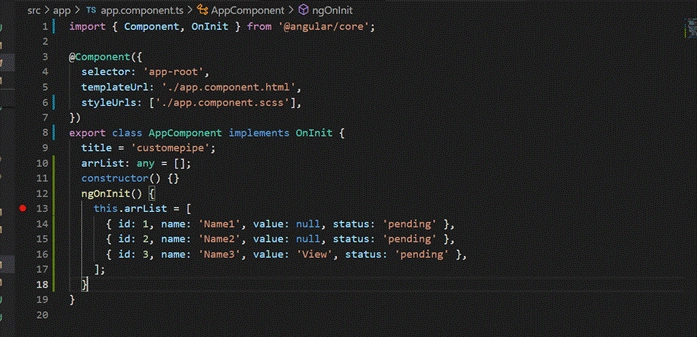
Next, we can create app.component.ts
- import { Component, OnInit } from '@angular/core';
- @Component({
- selector: 'app-root',
- templateUrl: './app.component.html',
- styleUrls: ['./app.component.scss'],
- })
- export class AppComponent implements OnInit {
- title = 'customepipe';
- arrList: any = [];
- constructor() {}
- ngOnInit() {
- this.arrList = [
- { id: 1, name: 'Name1', value: null, status: 'pending' },
- { id: 2, name: 'Name2', value: null, status: 'pending' },
- { id: 3, name: 'Name3', value: 'View', status: 'pending' },
- ];
- }
- }
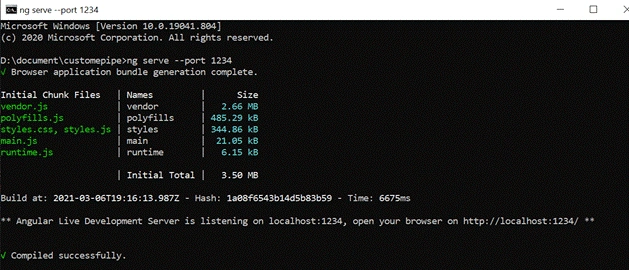
Now, we can run the code
ng serve --port 1234
Step 6
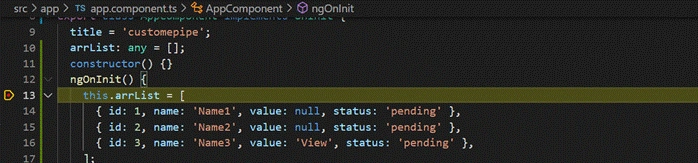
Now, we can add a breakpoint in the app component file and test the application:
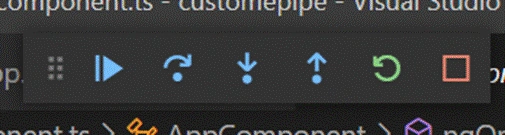
Now, the Debug toolbar will display on the top of the editor.
Step 7
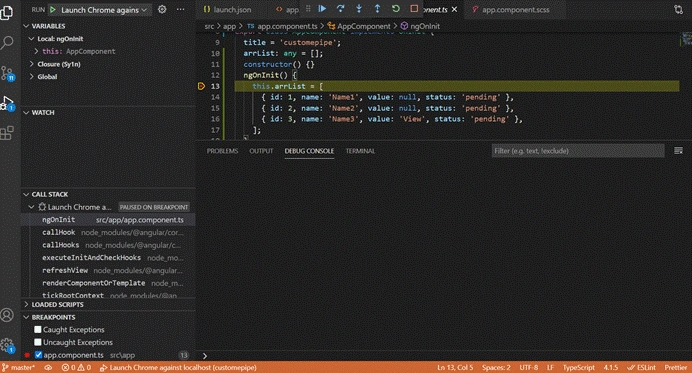
Now we can click the launch chrome again. It will run the Chrome browser.
Debugger shortcuts are below:
- Step Over F10
- Step Into F11
- Step Out Shift+F11
- Restart Ctrl+Shift+F5
- Continue / Pause F5
- Stop Shift+F5
Step 7
Now, in our visual Studio code, the debuggers are working successfully for our application.
Step 8
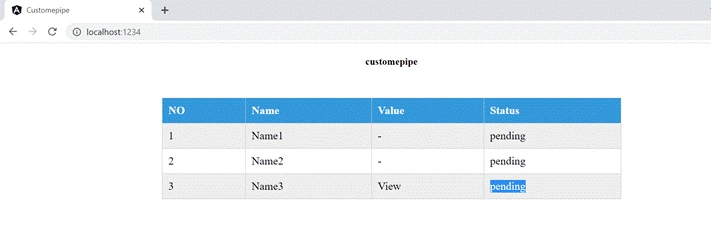
On successful execution of the above command, it will show the browser:
Conclusion
After reading this, you know more about debugging in Visual Studio Code and how to practice it.
Join the conversation! Your thoughts help the community grow.