

When an ASP.NET developer uses jQuery or JavaScript (clientside programming) in his code, the question always arises of how to debug this code. We can debug in code behind with breakpoints. But what for clientside scripting. Some people say use "alert()", but I don't think this is a sufficient way to do it.
So the good news is that we have the "debugger" keyword to debug your line of code.
Use debugger before your code, where you want to start debugging.
See the following code:
<html xmlns="http://www.w3.org/1999/xhtml">
<head runat="server">
<title></title>
<script src="Scripts/jquery-1.7.1.min.js"></script>
<script>
$(document).ready(function () {
$(':radio').click(function () {
debugger;
//Get the value of Radio button
var _GetVal = $(this).attr('value');
});
});
</script>
</head>
<body>
<form id="form1" runat="server">
<div>
First
<input type="radio" name="rd1" value="10" />
<input type="radio" name="rd1" value="11" />
Second
<input type="radio" name="rd1" value="12" />
<input type="radio" name="rd1" value="13" />
</div>
</form>
</body>
</html>
This is a simple ASP.NET in page code. When the user clicks a radio button, debugging will automatically start, due to the debugger command. In the above program, when the user clicks on the radio button we stored its value in the _Getval variable.
$(document).ready(function () {
$(':radio').click(function () {
debugger;
//Get the value of Radio button
var _GetVal = $(this).attr('value');
});
});
You can see that when I declare a _GetVal variable, before I use "debugger" because from here I want to start debugging. See the following images.
Figure 1: When user clicks in the radio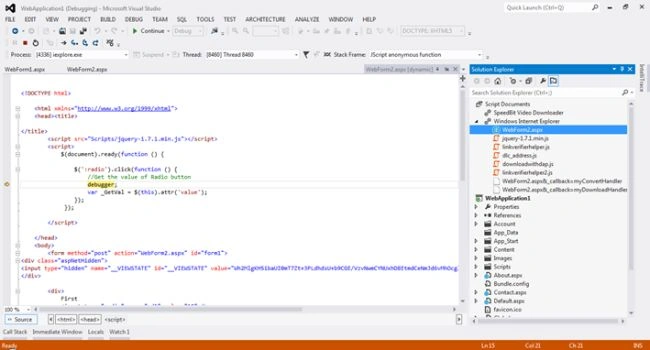
Figure 2: When the user presses F10 (the same way as what we did in code behind using a breakpoint).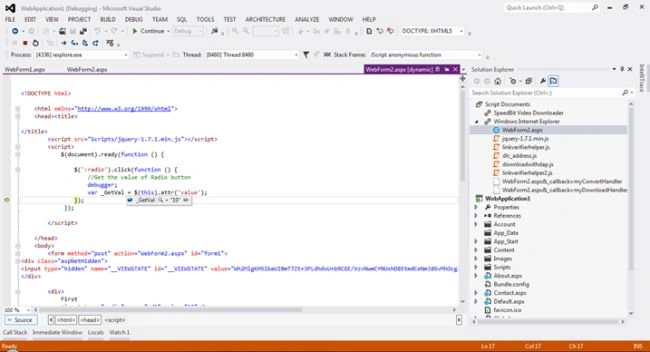
In the image above you can see that the _GetVal value is 10 now. So with the use of the debugger you can start your debugging in ASP.NET.
And please remember, when you finish debugging or publish your page, please remove debugger from your code.
If you have any query, Please send your valuable Comments. Happy Programming.
Manav PandyaPosted Jun 15, 2017, 7:24 AM
But debugger is not working as you have mentioned
Manav PandyaPosted Jun 15, 2017, 6:43 AM
Nice share brother ..............
Devang JaniPosted Nov 4, 2016, 5:47 AM
When i debug with debugger, it will also debug to js file that i dont want and it not debugging to my API
Amit Kumar SinghPosted Mar 9, 2016, 5:01 AM
Nice Share
shajiya begamPosted Mar 9, 2016, 4:23 AM
nice post.. useful for me.@Sourab Mishra
Anurag SarkarPosted Jun 3, 2013, 3:52 PM
nice.
Ravikumar GPosted May 7, 2013, 12:36 AM
nice...
Mahesh KumarPosted May 6, 2013, 1:39 PM
Sourabh, this command works in internet explorer browser only. Debugging in other browsers add-on are needed like firebug for mozilla. BTW good article for very beginners
Jack OwenseditedPosted May 1, 2013, 6:27 PMEdited May 1, 2013, 6:29 PM
1. If the user forgets to comment/remove the word "debugger" and publishes how does the deployed application behave?2. Is there any easy way (Global Setting) to say disable "debugger" code within "jQuery" code section such that everywhere developer has added "debugger" code is all commented or ignored by complier?
Sourabh MishraPosted Apr 25, 2013, 12:26 PM
Dear Mahesh Sir and Anil Sir, thanx for your valuable comments.
Anil KumarPosted Apr 25, 2013, 2:55 AM
Saurabh, plz don't feel hurt. You explained how to use 'debugger' very nicely.
Anil KumarPosted Apr 25, 2013, 2:52 AM
1) debugger is not a jQuery command. 2)It is used to suspend the execution in Javascript and very similar to setting breakpoint 3)'So the good news is that we have a command in jQuery, it is "debugger"' this line should be corrected. 4) Mahesh sir: It is not new feature. 5) Admin panel: it was a good blog instead
Mahesh ChandPosted Apr 24, 2013, 11:18 PM
Nice Saurabh. I think this feature is added in Visual Studio 2012?