

Introduction
In this article, we’ll build a simple solution where:
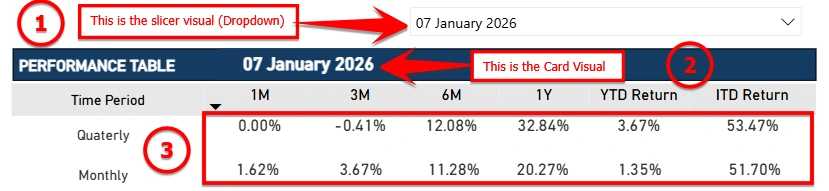
A Date slicer controls the report.
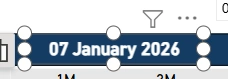
A Card visual displays the selected date.
A Performance table reflects data only for that selected date.
Use Case Scenario
You are building a Performance Report where:
The user selects a specific date (e.g., 31 December 2025).
The header must show the selected date.
All return calculations (1M, 3M, 6M, 1Y, YTD, ITD) in an table visual must reflect that selected date data.
Step-by-Step Implementation
Step 1: Prepare Your Date Table (Recommended Best Practice)
Make sure you have a proper Date table.
Calendar =
ADDCOLUMNS(
    CALENDAR(DATE(2020,1,1), DATE(2026,12,31)),
    "Year", YEAR([Date]),
    "Month", FORMAT([Date], "MMM"),
    "Month No", MONTH([Date])
)
Step 2: Create One to Many (1:M) relationship between
Calendar [Date] - (1) to Your Fact Table (e.g., FactReturns[Date]) - (M)
Step 3: Add a Date Slicer
Add a Slicer visual.

Drag Calendar[Date] into the slicer.
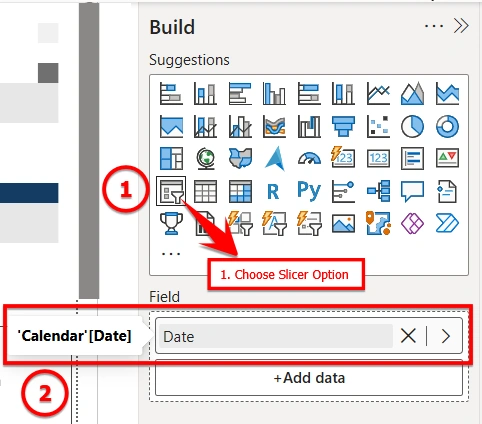
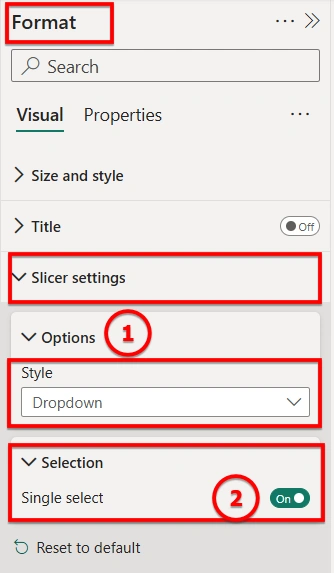
Change slicer type to
Dropdown
OR List
Turn on Single Select (Recommended).
Now users can select only one date.
Step 4: Create a Measure to Capture Selected Date
We now create a measure to capture the selected date from slicer.
Selected Report Date =
FORMAT(
    SELECTEDVALUE('Calendar'[Date]),
    "dd  MMMM  yyyy"
)
You can change format as needed:
"dd MMM yyyy" , "dd MMMM yyyy" , "dd MM yyyy"
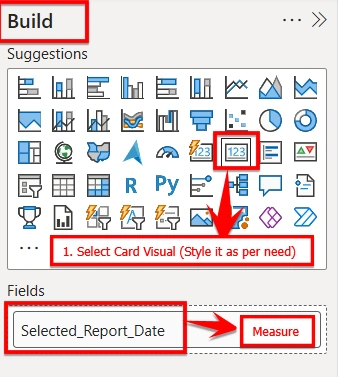
Step 5: Display Selected Date in a Card Visual
Add a Card visual. (adjust as per your need)
Drag Selected Report Date measure into the Card.
After adjustments card visual looks as :
Step 6: Make the Table Respond to Selected Date
If relationship is correct, the slicer will automatically filter the table.
Now, the output is cleaner and more optimized.
How It Works (Understanding Filter Context)
When a user selects a date:
Slicer applies filter to
Calendar[Date]Relationship filters Fact table
Measures calculate based on that date
Card visual reads same filter context
Both visuals stay synchronized
This is Power BI’s filter context engine at work.
Conclusion
Using a Date slicer with SELECTEDVALUE allows you to:
Create dynamic headers
Show selected context clearly
Build professional dashboards
Improve user experience
By leveraging slicers and DAX effectively, you can transform static reports into dynamic, context-aware dashboards that enhance clarity, accuracy, and user experience.
Join the conversation! Your thoughts help the community grow.