

In my previous blog you learned how to create a chart in ASP.NET.
In Business Application reporting functionality is important. So in this blog I describe how to export to Excel from an ASP.NET Chart control.
Step 1: Create a chart control.
First follow all the steps of my previous article "How to Create Chart in ASP.NET":
http://www.c-sharpcorner.com/Blogs/8620/how-to-create-chart-in-Asp-Net.aspx
<%@ Page Language="C#" AutoEventWireup="true" CodeFile="Default.aspx.cs" Inherits="_Default" %>
<%@ Register Assembly="System.Web.DataVisualization, Version=4.0.0.0, Culture=neutral, PublicKeyToken=31bf3856ad364e35"
Namespace="System.Web.UI.DataVisualization.Charting" TagPrefix="asp" %>
<!DOCTYPE html PUBLIC "-//W3C//DTD XHTML 1.0 Transitional//EN" "http://www.w3.org/TR/xhtml1/DTD/xhtml1-transitional.dtd">
<html xmlns="http://www.w3.org/1999/xhtml">
<head runat="server">
<title></title>
</head>
<body>
<form id="form1" runat="server">
<div>
<asp:Chart ID="Chart1" runat="server" Width="500px">
<Series>
<asp:Series Name="Education" XValueMember="State" YValueMembers="Education" IsVisibleInLegend="true">
</asp:Series>
</Series>
<ChartAreas>
<asp:ChartArea Name="ChartArea1" Area3DStyle-Enable3D="false">
<AxisX LineColor="DarkGray">
<MajorGrid LineColor="LightGray" />
</AxisX>
<AxisY LineColor="DarkGray">
<MajorGrid LineColor="LightGray" />
</AxisY>
<Area3DStyle Enable3D="false"></Area3DStyle>
</asp:ChartArea>
</ChartAreas>
<Legends>
<asp:Legend>
</asp:Legend>
</Legends>
</asp:Chart>
</div>
<div>
<asp:Button ID="btnExcel" runat="server" Text="Export To Excel" OnClick="btnExcel_Click" />
</div>
</form>
</body>
</html>
Step 2: Add an ASP Button control and in its click event call your .cs file as in:
using System;
using System.Collections.Generic;
using System.Linq;
using System.Web;
using System.Web.UI;
using System.Web.UI.WebControls;
using System.Data;
using System.IO;
using System.Web.UI.HtmlControls;
using System.Web.UI.DataVisualization.Charting;
public partial class _Default : System.Web.UI.Page
{
string tmpChartName = "test2.jpg";
protected void Page_Load(object sender, EventArgs e)
{
if (!IsPostBack)
{
CreateChart();
}
}
private void CreateChart()
{
var table = new DataTable();
table.Columns.Add("State", typeof(string));
table.Columns.Add("Education", typeof(long));
table.Columns.Add("Lbl");
var row = table.NewRow();
row["State"] = "Gujarat";
row["Education"] = 791;
table.Rows.Add(row);
row = table.NewRow();
row["State"] = "Delhi";
row["Education"] = 978;
table.Rows.Add(row);
row = table.NewRow();
row["State"] = "Rajasthan";
row["Education"] = 1262;
table.Rows.Add(row);
row = table.NewRow();
row["State"] = "Panjab";
row["Education"] = 1650;
table.Rows.Add(row);
row = table.NewRow();
row["State"] = "Maharastra";
row["Education"] = 2519;
table.Rows.Add(row);
row = table.NewRow();
row["State"] = "Madyapradesh";
row["Education"] = 6071;
table.Rows.Add(row);
Chart1.DataSource = table;
Chart1.DataBind();
string imgPath = HttpContext.Current.Request.PhysicalApplicationPath + tmpChartName;
Chart1.SaveImage(imgPath);
}
So your output is like: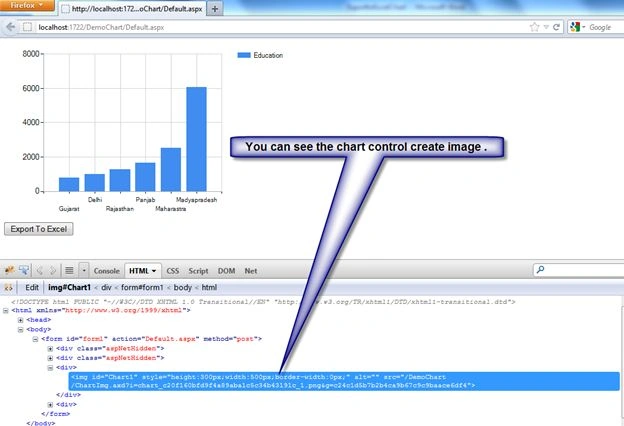
You can see that the .Net chart control creates an image. So we save the chart control as an image.
And call export to Excel.
protected void btnExcel_Click(object sender, EventArgs e)
{
string imgPath2 = Request.Url.GetLeftPart(UriPartial.Authority) + VirtualPathUtility.ToAbsolute("~/" + tmpChartName);
Response.Clear();
Response.ContentType = "application/vnd.ms-excel";
Response.AddHeader("Content-Disposition", "attachment; filename=test.xlsx;");
StringWriter stringWrite = new StringWriter();
HtmlTextWriter htmlWrite = new HtmlTextWriter(stringWrite);
string headerTable = @"<Table><tr><td><img src='" + imgPath2 + @"' \></td></tr></Table>";
Response.Write(headerTable);
Response.Write(stringWrite.ToString());
Response.End();
}
}
User77Posted Nov 3, 2016, 12:37 AM
Hi, I am using your code it's working in locally but when i added same code to server machine it's chart control is not exporting to excel i am using 3.5 frame work and IIS7 please tell me what is the problem in that Thank you
MinakshiPosted Mar 21, 2016, 7:26 AM
Hi , In my application I have one page . In that Page i have two Grid and 4 chart control. i want to export both grid and chart control to excel. How to achieve in this in same excel file???
Bishan DassPosted Feb 13, 2016, 9:11 AM
thanks a lot sir , this article really helped me a lot
lizarazou nizarPosted Sep 21, 2015, 4:37 PM
Export not work
lizarazou nizarPosted Sep 21, 2015, 4:36 PM
the chart not displayed in Excel File
Tim Dev253Posted Sep 14, 2015, 10:29 PM
how to export this chart together with gridview to send as email as .xls extension?
veera muthuPosted Aug 31, 2015, 1:28 AM
i need export gridviwe to excel chart dynamically...??????
Carlos GutierrezPosted May 17, 2015, 8:45 PM
How can i export 4 gridvies and 6 chart controls in the same excel file.
sam samaPosted Jul 29, 2014, 9:43 AM
export is not working
Gohil JayendrasinhPosted Feb 25, 2013, 12:42 AM
nice one Haseet
Haseet SantokiPosted Feb 21, 2013, 6:54 AM
I also came across such scenario in one of my project. Here is the solution for exporting to excel and pdf. http://haseet.blogspot.in/2013/02/develop-chart-in-aspnet-with-export-to-excel-pdf-msoffice-openoffice.html
Former memberPosted Sep 30, 2012, 1:16 PM
This is really nice article http://www.dotnetpools.com/Article/ArticleDetiail/?articleId=22&title=Gridview%20Export%20To%20Excel%20In%20Asp.Net%20C#